Identifying Valid Pullbacks: Essential Strategies for Traders
📉 Identifying Valid Pullbacks: Essential Strategies for Traders 📉
Identificando Pullbacks Válidos: Estratégias Essenciais para Traders
Welcome back to ComLucro! In this video, we dive deep into one of the most critical skills for traders: identifying valid pullbacks. Pullbacks are key moments in the market where temporary pauses or reversals occur, giving traders valuable opportunities to enter trades with high probability. We’ll explore different types of pullbacks, including aggressive, corrective, and sweep pullbacks, along with detailed strategies for each.
Understanding valid pullbacks can significantly boost your trading success by helping you recognize genuine order blocks and market traps to avoid losses.
Recommended Tools:
TradingView – https://www.tradingview.com/?aff_id=119375
👉 Key Topics:
The importance of recognizing valid pullbacks
How to analyze candlesticks in pullback scenarios
Different types of pullbacks and how to trade them
Practical examples of valid pullbacks in real market conditions
If you’re looking to refine your strategy and enhance your entries with solid pullback techniques, this video is for you. Watch until the end for a complete breakdown of how to implement these strategies successfully!
Subscribe, hit the notification bell 🔔, and share this video to help other traders succeed!
💬 Connect With Us:
Trading: https://www.comlucro.com.br/
Twitter: https://twitter.com/canalcomlucro
#ValidPullbacks #TradingStrategies #PullbackAnalysis #MarketStructure #SmartMoney #OrderBlocks #TechnicalAnalysis #LiquidityZones #TradingView #TradingPlan #RiskManagement #CandlestickPatterns #ForexTrading #ComLucro
00:00 - hello Traders and welcome back to another video on the Comm lukro Channel this video is a chapter from our smart money Concepts course dedicated to the topic of identifying valid pullbacks
00:11 - recognizing a valid pullback is one of the most critical and difficult aspects of Market structure analysis that every Trader faces developing the ability to identify valid pullbacks enables you to
00:23 - pinpoint genuine order blocks and inducement zones in the market helping you steer clear of potential traps today in this Advanced episode we are diving into various pullback types trading
00:34 - strategies and price actions associated with pullbacks that you might encounter in the market but that's not all we'll break down the key criteria and rules that elevate a pullback to a high
00:44 - probability trade see you after this very important message hey Traders if you're looking to level up your trading game give this video a thumbs up subscribe to the channel and hit that
00:55 - notification Bell so you never miss an update before we dive in we highly recommend checking out our playlists on trading psychology and risk management these videos can significantly help you
01:06 - manage emotions maintain discipline and develop effective risk management strategies key elements for achieving profitability in trading please listen and remember no amount of study to find
01:18 - the perfect trading strategy will benefit you if you lack emotional control during your trades if you cannot accept a losing trade and keep moving your stoploss or Worse trade without a
01:29 - stoploss you are setting yourself up for failure the efficiency of your strategy is directly tied to your risk management and emotional discipline only when a Trader understands and implements this
01:40 - can they start seeing consistent profits and end their months in the green without these critical elements even the best strategies will crumble under poor execution and emotional decision-making
01:51 - now let's get [Music] started the initial step in mapping pullback Market structures is identifying valid pullbacks without
02:02 - recognizing a valid pullback you cannot anticipate future price movements such as continuation Trends structural breakouts and reversal patterns so what exactly is a pullback essentially a
02:14 - pullback is a temporary reversal or pause in price action countered to the prevailing Trend this happens when buyers and sellers viy for control in the market resulting in a trending or
02:24 - impulsive movement that generates internal liquidity marked by inefficiencies or static liquidity waiting to be swept or filled as a result the price under go a reversal and
02:35 - a brief Interruption against the dominant Trend filling internal liquidity or clearing static liquidity before resuming its overall direction price movement is comprised of three
02:45 - primary submovements impulse corrective and continuation for instance if we view this corrective move as a valid pullback it confirms a break of structure moreover we can pinpoint an order Block
02:57 - located at the bottom linked to the BOS in this situation we anticipate the price reaching our identified order block and reversing direction to the upside to meet this expectation we might
03:09 - place our by limit order at the peak of the order block however consider a scenario where our identified pullback turns out to be invalid erroneously regarded as valid due to its impulsive
03:20 - nature in such a scenario our identified order block loses its validity with a high likelihood of the price hitting our stop loss now let's delve into how to identify a valid pullback and the
03:32 - essential criteria and rules involved ensure you watch the video attentively until the end because in the second section we will explore various pullback types price actions and discuss trading
03:44 - strategies related to pullbacks that you might encounter in the market before diving into Candlestick examples of valid pullbacks let's quickly review Candlestick uptrends and downtrends an
03:55 - uptrend based on candlesticks is identified by a pattern where the price action produc produces consecutive bullish candles with each candle surpassing the highest point of the
04:05 - previous one indicating strong upward momentum in a single bullish impulse movement it is crucial that the lowest point of each candle remains at or above the lowest point of the preceding
04:16 - candles this condition suggests that bearish momentum in the market is limited and the overall trend remains predominantly bullish the same principles apply to bearish scenarios a
04:28 - Candlestick based downtrend is characterized by a pattern where the price action produces consecutive bearish candles with each candle exceeding the lowest point of the
04:37 - previous one indicating strong downward momentum in a single bearish impulse movement it is essential that the highest point of each candle remains at or below the highest point of the
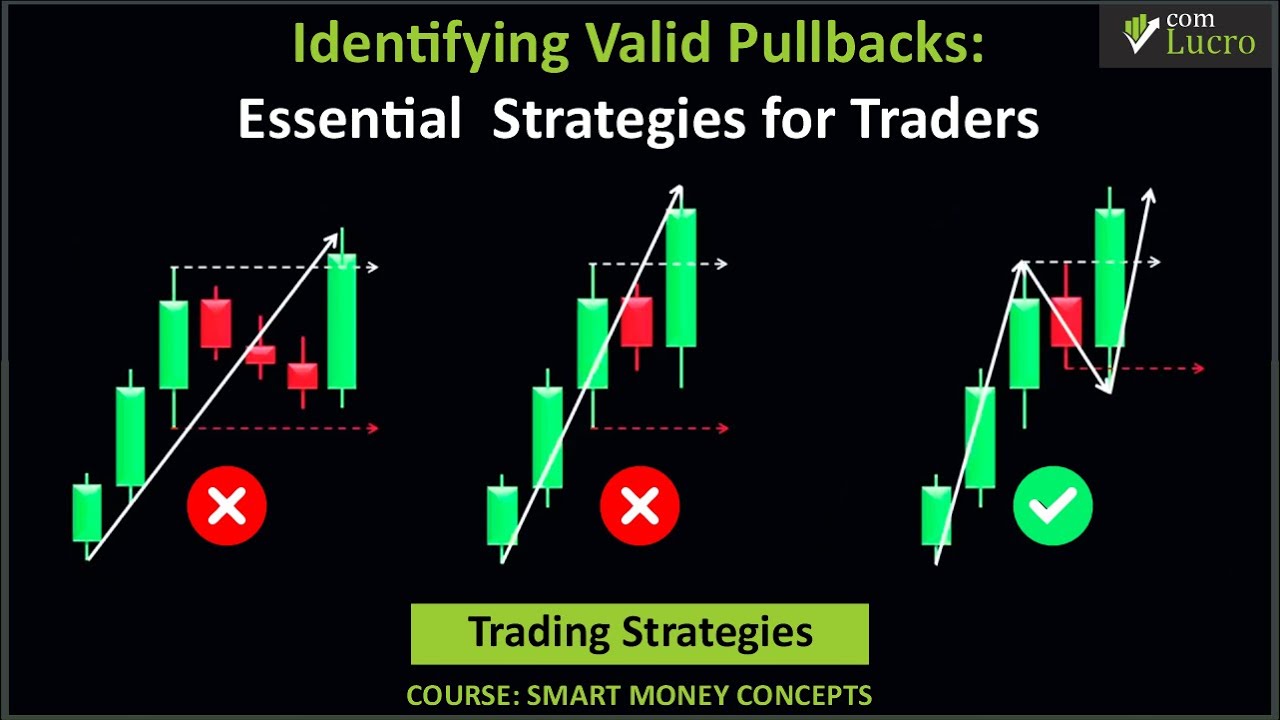
04:48 - preceding Candles now let's explore how to identify a valid pullback in the market in a bullish scenario a valid pullback is identified when a candle breaks below the lowest point of the
04:60 - previous candle or effectively sweeps its liquidity for instance in the given illustration the last Red candle has broken below the lowest point of the third green candle signaling a valid
05:11 - pullback it's essential to note that if the price does not break below the lowest point of the last green candle the pullback cannot be deemed valid it's also important to stress that the color
05:22 - of the candle does not influence the identification of pullbacks similarly in a bearish scenario a valid pullback is recognized when a candle breaks above the highest point of the previous
05:34 - candles sweeping liquidity in the process to deepen our understanding of pullbacks let's review more examples consider a series of bullish candles as Illustrated after forming three
05:46 - consecutive bullish candles the price takes a temporary pause marked by the emergence of three bearish candles before continuing its upward push in the context of a bullish scenario for a
05:57 - pullback to be valid the price must break below the lowest point of the last bullish candle formed just before the temporary bearish pause however this does not qualify as a valid pullback
06:09 - because none of the bearish candles has broken the lowest point of the preceding bullish candle or swept its liquidity consequently we consider this sequence of candles as a single bullish impulse
06:21 - move in a similar scenario in the second candle series we observe that after the formation of successive bullish candles a temporary pause occurs with the appearance of a single bearish candle
06:33 - since the price has not broken the low of any previous candle in this sequence we cannot consider it a valid pullback either conversely if the bearish candle forms an equal high with the previous
06:45 - bullish candle and the subsequent candle breaks and sweeps below the low of the bearish candle it qualifies as a valid pullback thus we have a bullish impulsive wave followed by a correction
06:56 - and then another bullish continuation wave these concepts are also applicable to bearish markets it's important to note that these principles can be applied across various time frames and
07:06 - any price action based chart here we are examining the euro dollar 1hour time frame as you can see the price is in a strong downtrend now let's identify the possible pullbacks by analyzing the
07:18 - chart we observe a sequence of three bearish candles followed by a temporary pause marked by three successive bullish candles drawing lines from the highest and lowest points of the last bearish
07:28 - candle before the the temporary pause shows that none of the subsequent candles has surpassed the high of this bearish candle consequently this does not qualify as a valid pullback and
07:39 - should be considered an Impulse move to confirm a valid pullback the price must break or sweep the liquidity below the latest candle created just before the temporary pause in the following example
07:50 - we can see that the price has broken the high of this candle and then continued in its primary Direction so we have a valid pullback here similarly we have another pullback as the price has broken
08:01 - the highest point of this candle which was the latest high before the temporary pause subsequently another valid pullback is created by this bullish engulfing candle that has broken the
08:12 - highest point of its previous candle having covered the basic concepts of pullbacks in the first part of this video we can now identify valid pullbacks in the market in the second
08:22 - part we will explore advanced concepts of pullbacks including various types that Traders May encounter and the trading strategies associated with them pullbacks can be categorized into three
08:33 - distinct models aggressive corrective and sweeping now let's dive into the details of each type of pullback and examine how we can use them to enhance the systematic nature of our trading
08:43 - plan the first pullback type is the aggressive pullback an aggressive pullback is characterized by a rapid and sharp retracement against the prevailing Trend it often occurs with a couple of
08:54 - large and strong candles that quickly retrace a portion of the recent price movement let's imagine we we have a series of candles like this one as you can see the price has broken below the
09:04 - lowest point of this candle which was the latest low before the temporary pause and reversal indicating a valid pullback here after completing its corrective movement the price reversed
09:14 - and pushed to the upside with great inefficiency so we have a valid break of structure as the price has formed a valid pullback now since the price has created a bullish break of structure we
09:25 - can identify this demand Zone attributed to it which we believe has a high potential to reverse the price when it reaches that point next we wait for the price to move back down again and tap
09:36 - into our identified demand Zone in the aggressive pullback type the price generates a rapid and drastic movement with strong candles that quickly retrace toward our identified demand or Supply
09:47 - Zone in this scenario we wouldn't consider entering the market by opening any position even with the emergence of confirmation patterns like the change of character or flip patterns in the lower
09:57 - time frame the rationale behind this is that if the price rapidly and drastically moves with strong candles into a supply or demand Zone without losing its momentum there is a high
10:08 - probability that the price will not react to that zone Traders need to closely monitor price behavior in such cases and avoid entering the market in these situations now let's move on to
10:19 - the second type of pullback the corrective pullback model the corrective pullback is a more gradual retracement that typically consists of multiple smaller candles in this type type of
10:30 - pullback the price generates several internal structures until it reaches the point of interest and its momentum and volatility subside as it approaches the point of Interest as we mentioned
10:41 - earlier in this example we have a pullback as the lowest point of this candle has broken to the downside subsequently we have a valid break of structure and we have a valid order
10:51 - block which we believe has a high potential to reverse the price when it reaches that zone in the corrective pullback model as mentioned earlier the price forms several internal structures
11:02 - with multiple smaller candles until it reaches our identified point of Interest unlike the aggressive pullback we consider entering the market when the price reaches our identified demand or
11:13 - Supply Zone to do this we can use Smart money Concepts various entry models such as aggressive or conservative entry models for example in this case we can place a buy limit order at the highest
11:24 - point of our identified order block and wait for the price to activate it or we can implement m a more conservative approach by waiting for the price to tap into our identified Zone and then zoom
11:34 - into a lower time frame to search for any signs of change of character or reversal patterns to confirm a market structure shift after detecting the confirmation of a market structure shift
11:44 - on the entry time frame we can set our entry position at the highest point of the newly recognized order Block in this case a demand Zone on the lower time frame created by the change of
11:54 - characters wave with a stop loss set a few Pips above the lowest point of the zone for the takeprofit we set it at the external liquidity of the higher time frame now let's proceed to the next
12:06 - pullback type the sweeping model in this type of pullback the price generates liquidity pools waiting to be swept near our point of Interest by forming a static liquidity Zone such as equal
12:16 - highs equal lows or trendline liquidity recognizing a liquidity sweep pattern before the price reaches our point of interest is crucial as this pattern confirms the strength of our supply or
12:28 - demand area we use liquidity sweeps as a confirmation Factor the concept is simple the market requires liquidity for momentum if the price doesn't sweep liquidity before a key level it often
12:40 - uses that zone as liquidity to fuel its momentum for example here we can see that the price retraced back down formed an equal low and created significant liquidity below the double bottom
12:51 - suggesting the presence of pending orders and stop losses waiting to be triggered and swept by the market which is located near our identified demand Zone
12:60 - by focusing on zones with liquidity sweep patterns we can increase the probability of trading setups that align with market dynamics and reduce the risk of falling into false signals or traps
13:11 - the presence of the liquidity pool above our identified demand Zone provides additional confirmation for a potential price reversal from our point of Interest now that we have the desired
13:21 - Confluence our next step is to patiently wait for the price to sweep the liquidity below the equal lows with our desired confluence uence in place we can consider entering the market by going
13:32 - long from our point of interest to do this we can place our buy limit order at our demand Zone if we want to optimize our entry point and achieve a better reward to risk ratio with a tighter stop
13:43 - loss we need to zoom into a lower time frame and wait for the price to tap into the demand Zone and show a change of character or any Market structure shift signal after the formation of the newly
13:54 - generated demand Zone on the lower time frame we can consider placing a trade in concl in usion understanding the nuances of identifying valid pullbacks is a critical skill for any Trader looking to
14:06 - optimize their Market entries and exits by mastering the concepts of aggressive corrective and sweeping pullbacks Traders can enhance their strategy and increase the likelihood of successful
14:18 - trades recognizing these patterns not only helps in pinpointing genuine order blocks and inducement zones but also AIDS in avoiding potential Market traps that can lead to significant losses
14:30 - remember the key to consistent profitability lies in combining these technical insights with disciplined risk management and emotional control the efficiency of your strategy is directly
14:41 - tied to how well you manage risk and maintain emotional discipline only by integrating these elements can Traders start seeing consistent profits and end their months in the green without these
14:52 - critical components even the best strategies will falter under poor execution and emotional decision- making I hope you enjoyed today's video if you found the content useful or fun please
15:03 - give it a like as this helps the video reach more Traders like you remember to subscribe to the channel and activate notifications to stay updated with the latest Financial Market information and
15:13 - trading tips sharing this video with your friends or on your social networks can make a big difference and helps our community become stronger your support allows us to continue bringing
15:24 - highquality content helping you make more informed decisions in the markets thank you for watching and good luck on achieving excellent results in your trades
