Mastering Bullish Divergence with MACD #trading #macdindicator #crypto
📈 Mastering Bullish Divergence with MACD: Catching Market Reversals Like a Pro!
🔔 Subscribe to stay updated with our latest trading insights and take your trading game to the next level!
Welcome to ComLucro! In this video, we’ll show you how to identify bullish divergence with the MACD to pinpoint potential market reversals. A bullish divergence can be a powerful signal that sellers are losing strength, paving the way for a possible trend reversal. Learn to analyze price action, mark support and resistance, and master the MACD signal for confident, informed trades. This tutorial will help you build skills to identify structure, backtest setups, manage risk, and use stop losses effectively. Let’s trade smarter together!
👉 Key Points:
Identifying Bullish Divergence with MACD
Using Support & Resistance to Confirm Entries
How MACD Signals Weakening Seller Momentum
Essential Risk Management Techniques for Safer Trades
Mastering Stop Loss Placement and 1:1 Risk-to-Reward Strategy
Join us on this journey to develop advanced trading skills and turn insights into actionable strategies!
🚨 Subscribe: Don’t miss our upcoming videos!
🔔 Turn on Notifications: Stay tuned for the latest trading strategies!
👍 Like & Share: Support the channel and help us reach more traders like you!
💬 Comment Below: Share your thoughts or questions; we love hearing from you!
💬 Connect with Us:
Trading Tips: https://www.comlucro.com.br/
Twitter: https://twitter.com/canalcomlucro
#MACD #BullishDivergence #TradingTips #TechnicalAnalysis #MarketReversals #SmartTrading #SupportAndResistance #RiskManagement #PriceAction #TradingPsychology #TradingEducation #DayTrading #SwingTrading #StockMarketTips #CryptoTrading #ForexTrading #TradingCommunity #TradeLikeAPro #FinancialMarkets #TradingInsights #TradeSetups #ChartPatterns #StopLoss #ProfitStrategy #InvestmentEducation
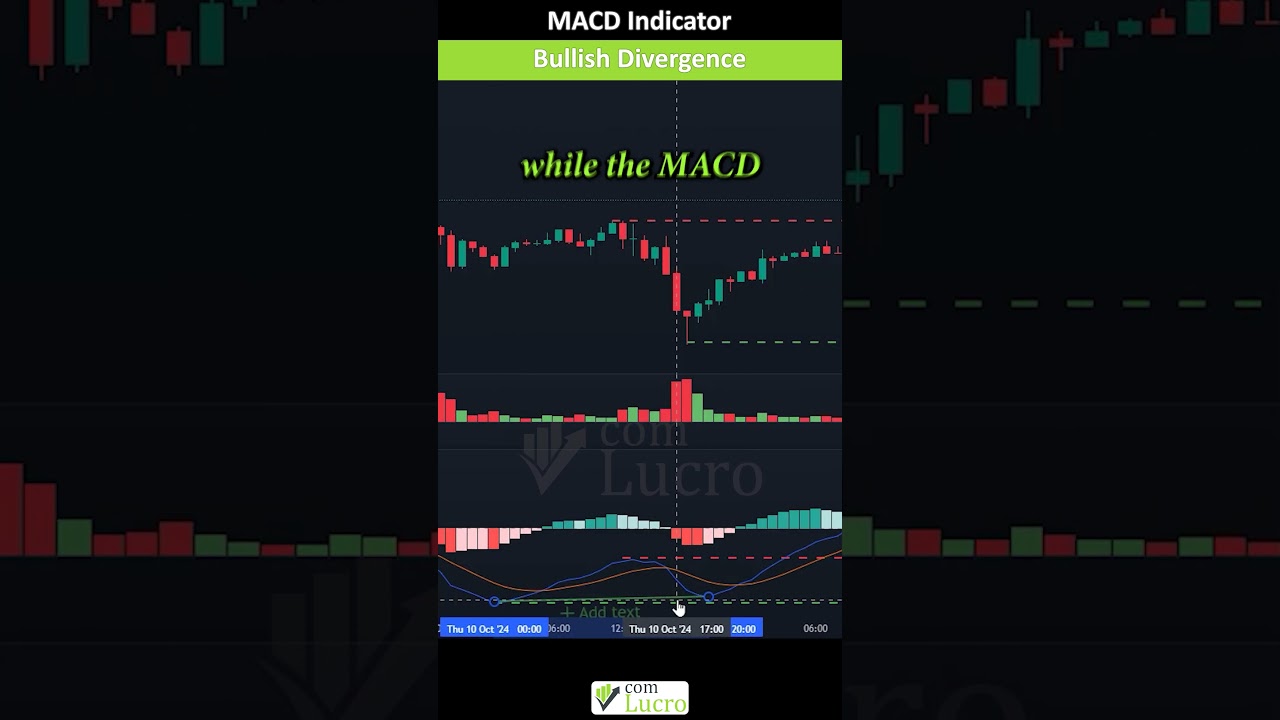
00:00 - Hey Traders! Today, we're diving into bullish
divergence with the MACD to help you catch potential reversals to the upside. When price
makes a new low but the MACD forms a higher low, that’s a bullish divergence. This signals
that sellers are losing momentum, hinting at a possible reversal. A breakout above resistance
can confirm an entry for a long position. To train your eye in identifying price structure
and MACD divergence, start by marking support and
00:23 - resistance levels on both the price chart and the
MACD. When the price breaks above the most recent resistance with a candle close and the MACD
shows a bullish divergence—meaning the price makes lower lows while the MACD makes higher
lows, indicating weakening seller momentum—you can consider opening a long position. Set your
stop loss below the support level, with a target of at least a 1:1 risk-to-reward ratio or the
resistance high from the higher time frame.
00:46 - Here at ComLucro, we always recommend
analyzing the market structure thoroughly, backtesting your setup, maintaining
efficient risk management and ALWAYS having a stop loss in place!
Best of luck in your trades!
Perguntas Respondidas por esse Artigo
-
O que é uma divergência de alta (bullish divergence)?
-
Como identificar uma divergência de alta usando o MACD?
-
Qual a importância de usar suporte e resistência na confirmação de entradas em operações?
-
Por que o gerenciamento de risco é essencial em negociações?
-
Qual a importância do Stop Loss e qual estratégia utilizar?
