Best Candlestick Secrets Most Traders Miss: Master Candlestick Patterns for Trading Success
Best Candlestick Secrets Most Traders Miss: Master Candlestick Patterns for Trading Success
Are you ready to take your trading skills to the next level? Understanding candlestick patterns is crucial for any serious trader. These patterns offer a detailed view of market sentiment and potential price movements. This article dives into the essential candlestick secrets that many traders overlook, providing you with actionable insights to improve your trading strategy.
In this comprehensive guide, we will explore:
- The importance of candlestick patterns in trading.
- How to interpret the size and position of candlestick bodies.
- The significance of wicks (shadows) and their role in identifying price rejection.
- Practical examples to help you understand and apply these concepts.
Don’t miss out on these critical insights! Watch the video below to gain a deeper understanding of these candlestick secrets and transform your trading approach.
Why Candlesticks Are Essential for Traders
Candlesticks are favored by traders because they provide a more nuanced understanding of price movement than simple line charts. Each candlestick gives a complete snapshot of market sentiment during a specific period. Understanding how to read candlesticks can provide valuable insights into potential price direction and market strength.
Each candlestick contains four key pieces of information:
- Open: The price at which the trading period began.
- High: The highest price reached during the period.
- Low: The lowest price reached during the period.
- Close: The price at which the trading period ended.
The body of the candlestick represents the range between the open and close prices. The wicks (or shadows) represent the high and low prices reached during the period.
Decoding Candlestick Bodies: Size Matters
The size of the candlestick body is a strong indicator of market strength. A larger body indicates that one side (buyers or sellers) dominated the trading session. Conversely, a smaller body suggests indecision or a balance between buyers and sellers.
Large Body: Strong Momentum
A large green (bullish) body suggests strong buying pressure. Buyers controlled the price throughout the session, driving it significantly higher. This often indicates continued upward momentum.
A large red (bearish) body suggests strong selling pressure. Sellers dominated the session, pushing the price significantly lower. This often signals continued downward momentum.
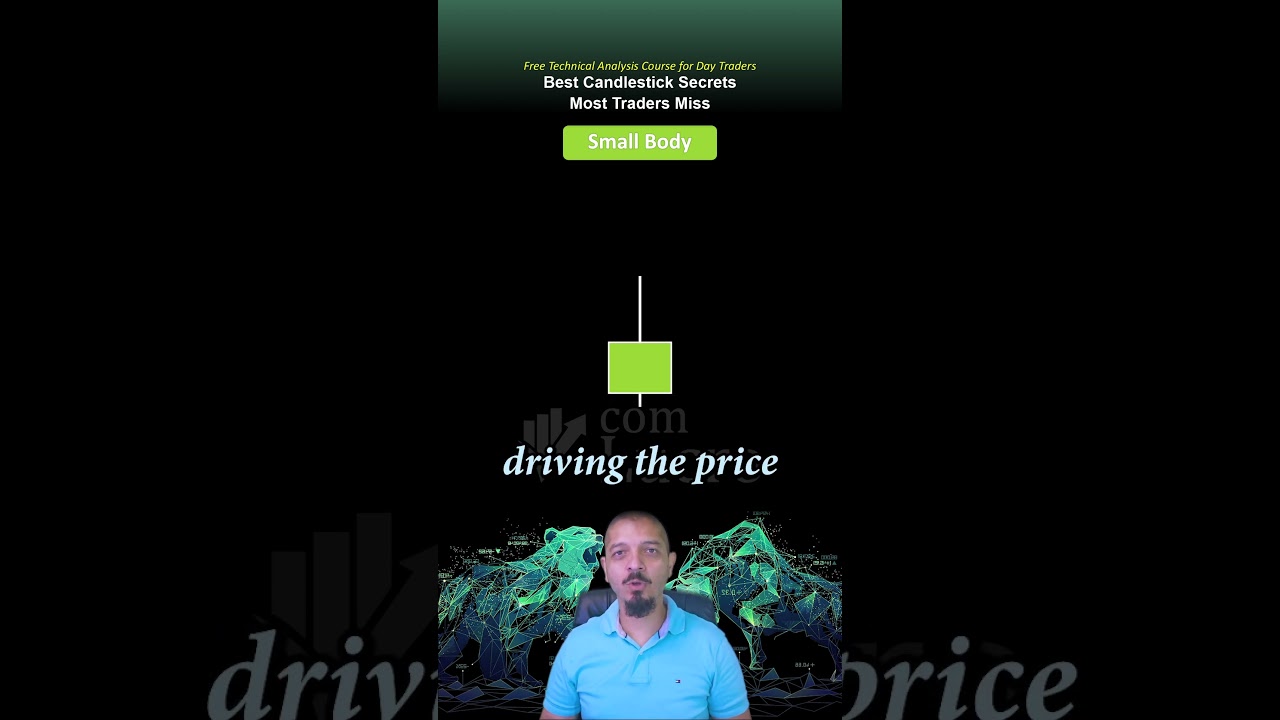
Small Body: Indecision or Balance
A small body suggests indecision or a close contest between buyers and sellers. This could indicate a potential reversal or consolidation period.
Understanding Wicks (Shadows): Price Rejection Signals
Wicks (also known as shadows) are just as important as the body. They provide key information about price rejection, which occurs when the market attempts to move in one direction but ultimately reverses.
Long Upper Wick: Resistance
A long upper wick suggests that buyers tried to push the price higher, but sellers overpowered them, creating resistance. This can be an early warning sign of a potential reversal.
Long Lower Wick: Support
A long lower wick indicates that sellers pushed the price down, but buyers stepped in and drove it back up, signaling support. This can indicate a potential bounce or reversal.
Putting It All Together: Practical Examples
Let’s consider a few practical examples to illustrate how to interpret candlestick patterns:
- Large Green Body with Small Wicks: This suggests strong buying momentum. Buyers were in control throughout the session, driving the price significantly higher with little resistance.
- Small Green Body with Long Upper Wick: This suggests that buyers managed to push the price higher, but sellers stepped in at the peak, driving the price back down. While the price closed higher than it opened, the smaller body indicates a closer contest between buyers and sellers.
- Long Red Body with Small Wicks: This suggests strong selling momentum. Sellers were in control throughout the session, driving the price significantly lower with little resistance.
- Small Red Body with Long Lower Wick: This indicates sellers pushed the price down, but buyers stepped in and drove it back up, signaling support.
Don’t Miss Out: Watch the Full Video!
Ready to deepen your understanding of candlestick patterns and elevate your trading strategy? The full video provides even more in-depth analysis and practical examples. You’ll learn:
- Advanced candlestick patterns and their implications.
- How to combine candlestick patterns with other technical indicators.
- Real-world trading scenarios and how to apply candlestick analysis.
Click now to watch the full video and transform your trading approach!
