How to Use Technical Indicators to Enhance Your Trading Strategy
Elevate Your Trading with Technical Indicators: A Comprehensive Guide
Are you looking to refine your trading strategy and make more informed decisions? Technical indicators are powerful tools that can help you interpret market movements and identify potential opportunities. This article will explore how indicators like moving averages, RSI (Relative Strength Index), and Bollinger Bands can enhance your trading prowess.
Understanding the Power of Technical Indicators
Technical indicators are mathematical calculations based on historical price and volume data. They provide insights into market trends, momentum, volatility, and potential reversal points. By using these indicators, traders can gain a deeper understanding of market dynamics and make more strategic decisions.
Key Technical Indicators Explained
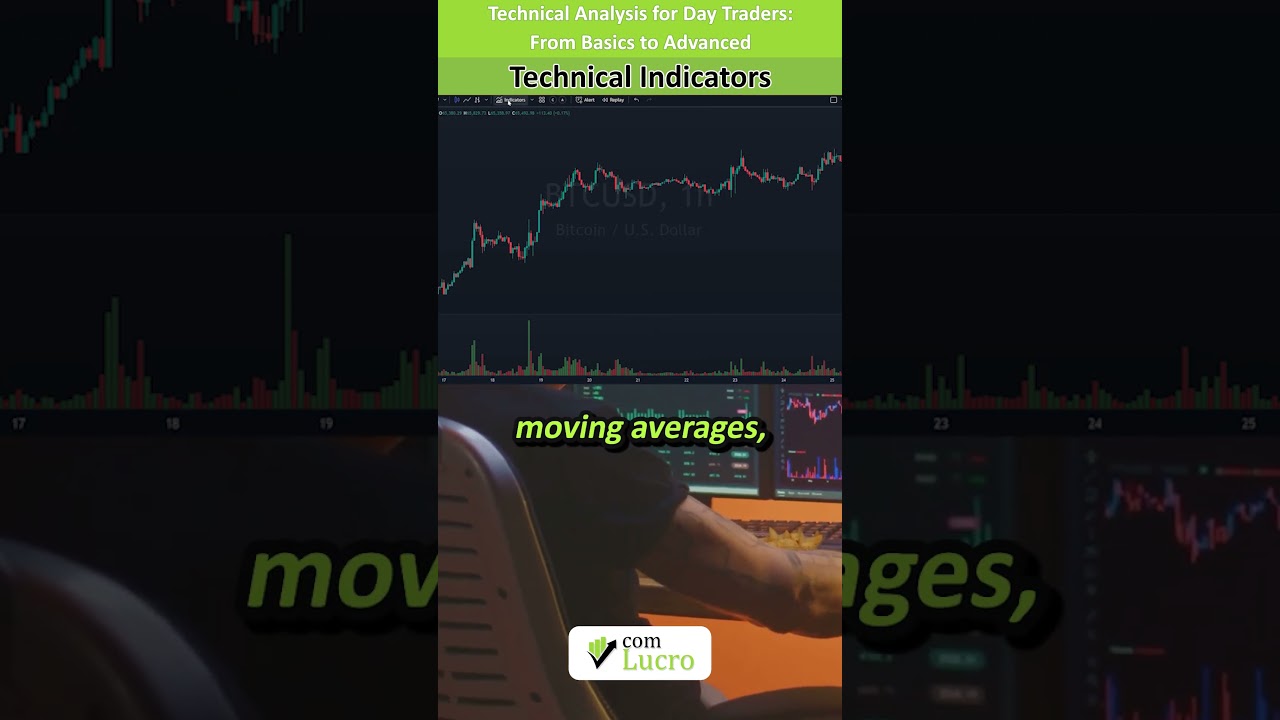
Moving Averages: Smoothing Out the Noise
Moving averages are one of the most basic yet effective technical indicators. They smooth out price data by calculating the average price over a specified period. This helps traders identify the overall trend and filter out short-term price fluctuations.
There are two primary types of moving averages:
- Simple Moving Average (SMA): Calculates the average price over a specified period by summing up the prices and dividing by the number of periods.
- Exponential Moving Average (EMA): Gives more weight to recent prices, making it more responsive to current market conditions.
Traders often use moving average crossovers to identify potential buy or sell signals. For example, when a short-term moving average crosses above a long-term moving average, it can signal a bullish trend.
RSI (Relative Strength Index): Gauging Momentum
The RSI is a momentum oscillator that measures the speed and change of price movements. It ranges from 0 to 100 and is used to identify overbought and oversold conditions in the market.
- Overbought: RSI above 70, suggesting the asset may be overvalued and due for a pullback.
- Oversold: RSI below 30, suggesting the asset may be undervalued and due for a bounce.
Traders also use the RSI to identify divergences, which can signal potential trend reversals. For example, if the price is making higher highs, but the RSI is making lower highs, it could indicate a weakening uptrend.
Bollinger Bands: Measuring Volatility
Bollinger Bands consist of a middle band (typically a 20-day moving average) and two outer bands that are a certain number of standard deviations away from the middle band. They expand and contract as volatility increases and decreases.
- Upper Band: Price approaching the upper band may indicate overbought conditions.
- Lower Band: Price approaching the lower band may indicate oversold conditions.
Traders often use Bollinger Bands to identify potential breakout opportunities. When the price breaks out of the bands, it can signal the start of a new trend.
Choosing the Right Indicator for Your Trading Style
The best technical indicators for you will depend on your trading style and preferences. Some traders prefer to use a combination of indicators to confirm signals and reduce the risk of false positives. It’s important to experiment with different indicators and find what works best for you.
Practical Benefits for Traders and Investors
- Improved Entry and Exit Points: Technical indicators can help you identify optimal entry and exit points for your trades, increasing your potential profits.
- Better Risk Management: By understanding market volatility and momentum, you can manage your risk more effectively and protect your capital.
- Enhanced Trend Identification: Technical indicators can help you identify and confirm trends, allowing you to trade in the direction of the market.
- Increased Confidence: Using technical indicators can give you more confidence in your trading decisions, reducing emotional biases.
Ready to Supercharge Your Trading? Watch the Full Video!
This article provides a glimpse into the world of technical indicators. To truly master these tools and unlock their full potential, we highly recommend watching the full video on the Comm lukro Channel. You’ll learn:
- Detailed explanations of each indicator and how to use them in practice.
- Real-world examples of how technical indicators can improve your trading decisions.
- Tips and tricks for choosing the right indicators for your trading style.
Don’t miss out on this valuable opportunity to enhance your trading skills. Watch the video now and start making smarter, more profitable trades!
