Boost Your Trading Success with 200 EMA + RSI + Engulfing Candles
📊 Discover the Ultimate Trend-Following Strategy!
Welcome to the Com Lucro channel! Today, we’re breaking down a high-probability trading strategy that combines the 200-day EMA, RSI indicator, and bullish engulfing candles. This structured approach is:
✔️ Easy to follow
✔️ Tested across multiple markets & timeframes
✔️ Proven to deliver consistent results
👉 What You’ll Learn
How to identify trends with the 200 EMA 📈
Using RSI for momentum confirmation ⚡
Spotting bullish engulfing candles like a pro ✅
Setting up trades with precise risk management 🎯
At Com Lucro, we focus on practical techniques for traders of all levels. Ready to level up your trading? Watch now!
💡 Additional Resources
🌐 Learn more on our website: https://www.comlucro.com.br
🔔 Subscribe for the latest strategies: https://comlucro.com.br/youtube
💬 Let’s Connect
Twitter: https://twitter.com/canalcomlucro
More tools: https://www.comlucro.com.br/tools
📌 Hashtags
#TradingStrategy #200EMA #RSI #BullishEngulfing #TrendFollowing #ForexTrading #StockMarketTips #ComLucro #TradingWithDiscipline #LearnToTrade
00:00 - Hello traders! Welcome back to the ComLucro
Channel! Today, we’re excited to share a powerful trend-following strategy that
combines the 200-period EMA, RSI momentum, and engulfing candles to create a structured,
high-probability approach to trading. This isn’t just about learning theory; we’ll guide you
through a clear set of rules and demonstrate how this strategy has been rigorously backtested and
proven effective. It’s versatile, working across
00:26 - nearly all markets and time frames, and most
importantly, it delivers consistent results. At ComLucro, our mission is to provide you
with the tools and knowledge to make smarter, more strategic trading decisions. We’re not here
to sell shortcuts or flashy promises. Instead, we focus on practical, tested techniques
that professional traders use to achieve consistent success. We’ve condensed these insights
00:49 - into actionable steps to save you time
and help you trade more sustainably. If you’re ready to level up your trading
skills, stay tuned. We’ll walk you through every detail of this strategy and share key
tips to maximize your results. Don’t forget to check out our other videos and visit our
website for even more in-depth resources. After this brief introduction, we’ll jump straight
into the details. You won’t want to miss them!
01:11 - Hey traders! If you're looking to level up
your trading game, give this video a thumbs up, subscribe to the channel, and hit that
notification bell so you never miss an update. Before we dive in, we highly recommend checking
out our playlists on trading psychology and risk management. These videos can significantly help
you manage emotions, maintain discipline, and develop effective risk management strategies—key
elements for achieving profitability in trading.
01:38 - Please, listen and remember! No amount
of study to find the perfect trading strategy will benefit you if you lack
emotional control during your trades. If you cannot accept a losing trade and
keep moving your stop loss, or worse, trade without a stop loss, you are
setting yourself up for failure. The efficiency of your strategy is directly tied
to your risk management and emotional discipline.
02:01 - Only when a trader understands and implements
this can they start seeing consistent profits and end their months in the green. Without these
critical elements, even the best strategies will crumble under poor execution and emotional
decision-making. Now, let's get started!
First, it’s important to point out that
many traders often make the mistake of
02:24 - trying to catch the absolute bottom or top in
a trend, hoping to perfectly time the reversal. While it sounds great to pinpoint the exact moment
a trend reverses and ride the move to massive profits, the reality is that finding that precise
point is extremely unlikely most of the time. If you’ve watched our videos before,
you know we’re all about probability and success rates. We’re firm believers
in trading with the chart, not against it.
02:49 - What we mean is, we only take trades
when the chart shows a clear uptrend. With that in mind, let’s dive into this strategy. So, let’s get right into it with rule
number one—and arguably the most important rule. We’ll only trade with the trend! At
least, that's the case for this strategy. Now, you might be wondering, "How do I know if a
chart is in an uptrend or a downtrend?" There are
03:10 - several ways to identify market trends, ranging
from price action analysis to advanced technical indicators. However, one of the quickest and most
widely used methods is through moving averages. To apply this, head over to TradingView,
click on the indicators tab, and type in EMA to add the exponential moving average to
your chart. Once it’s added, open the settings for the indicator and set the length to 200,
creating a 200-period moving average. We
03:35 - like to change the line to red for better
visibility, but that’s entirely optional. For this strategy, the first and most critical
rule is that we will only enter trades when the chart is in an uptrend. Specifically,
this means we will only take trades when the price is above the 200-period EMA. If
the price is below the 200-period line, we simply don’t trade. Remember, trading with
the trend is non-negotiable for this strategy.
03:58 - In this video, we’ll focus on how to trade
long positions using this strategy. If you’re looking to trade short, the concept is just as
straightforward—simply apply the rules in reverse. Now that we’ve covered rule number
one, let’s move on to the next rule that must be met before entering a trade. Rule
number two involves using the RSI indicator, but with a unique twist. Here’s how to set it up:
04:19 - Go to the indicators tab and type in
RSI Divergence—make sure to select this specific one. Once it’s added, we’ll
adjust the settings for better clarity. Open the settings, then uncheck the bottom three
checkboxes to clean up the chart. Next, navigate to the middle line tab, change the color to white,
and make it a solid line for better visibility. While the traditional RSI is often used
to determine if the market is overbought
04:41 - or oversold, we’ll use it differently in this
strategy—to measure momentum in the market. This brings us to rule number two: Only enter a
trade if the RSI line is above the middle white line. If all other conditions are met but the
RSI is below the line, we don’t enter the trade. An added bonus of this customized RSI
indicator is that it highlights divergences, giving you an extra edge in
spotting potential reversals.
05:04 - If you’re not familiar with divergences, here’s a simple explanation without getting
too technical: divergence happens when the price moves in one direction while the
indicator moves in the opposite direction. For example, if the chart is making higher
highs, but the RSI is making lower highs, that’s a divergence. The great thing about this
customized RSI indicator is that it automatically
05:25 - highlights when bullish divergence occurs,
making it easy to spot potential reversal points. That said, a quick disclaimer: We’ve
noticed that this RSI indicator can occasionally miss divergences,
so you might need to double-check manually from time to time. Just
keep that in mind as you use it. That said, it’s still a fantastic tool overall.
While spotting bullish divergence isn’t a strict
05:46 - rule for this strategy, it’s definitely a strong
confirmation signal if you happen to see it. When all the other rules are in place,
let’s move on to rule number three. If you’ve watched our previous videos,
you know we have a strong preference for momentum candles. They’re a fantastic
way to identify the start of a trend. The specific momentum candle we’re focusing on
is called an engulfing candle. Simply put,
06:07 - an engulfing candle is one that
completely engulfs the previous candle. A bullish engulfing candle opens at or below
the previous candle’s close. The length of the bullish candle’s body engulfs the previous red
candle, and it closes above the previous candle’s open. This pattern is a powerful signal
for spotting the beginning of an uptrend. Rather than manually scanning for this
candle and watching the chart all day,
06:28 - we’ll let an indicator handle it for us. Go
to the indicators tab and type in "Engulfing Candle"—select this one right here. After
adding it, you’ll notice a series of red and green arrows on your chart. Since we’re
focusing on long trades in this example, you can disregard the red arrows. All the green
arrows point out bullish engulfing candles. Finally, let’s move on to rule number
three: We will only enter a trade if we
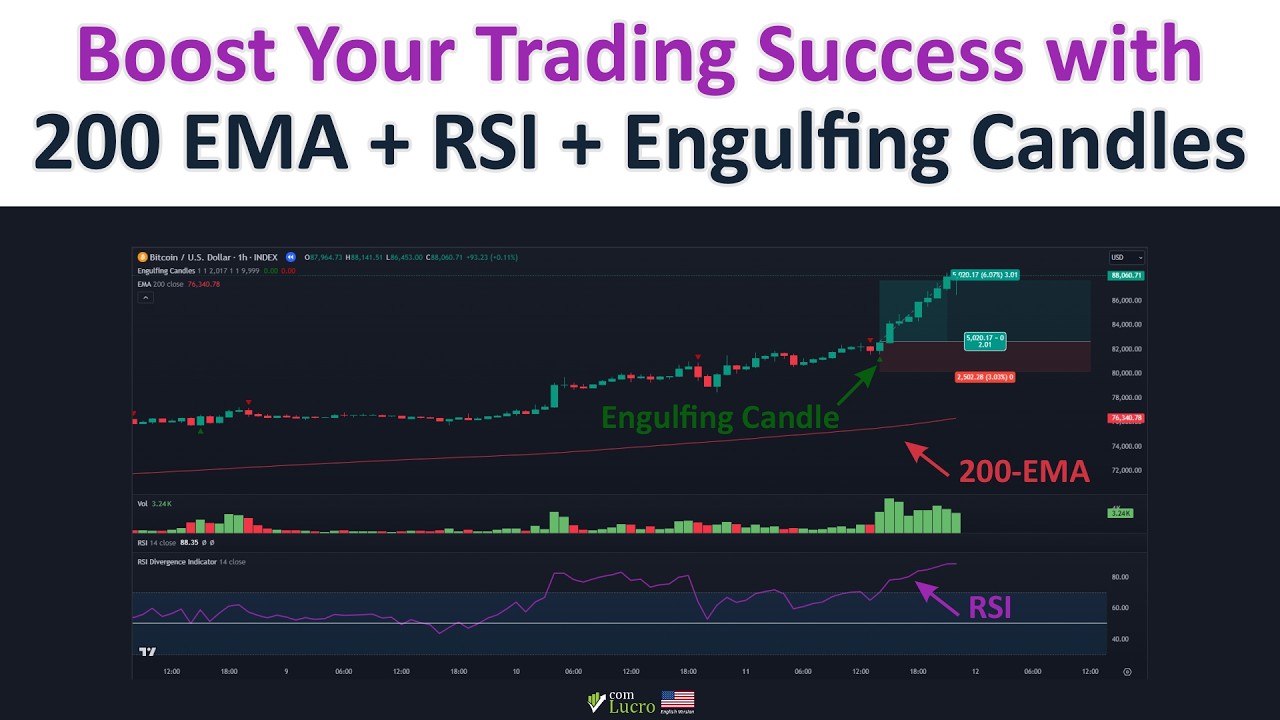
06:50 - see a green arrow. Now, let’s break down
what a successful trade setup looks like: First, confirm that the price is above the
200-period line, indicating the chart is in an uptrend. So far, so good.
Next, check that the RSI line is above the 50 mark—and in this case,
it is. Great, we’re still on track. Seeing a bullish divergence is not a requirement,
but if it’s there, it’s an extra confirmation—a
07:14 - “plus one” that makes the trade even more bullish.
Finally, look for a green arrow, which indicates a bullish engulfing candle. Important note:
we will only enter the trade after the green arrow candle closes. I repeat: do not enter until
the candle with the green arrow has fully closed. Keep in mind, a candle might show a
green arrow while it’s still forming, but it can change before it closes, ultimately
not qualifying as an engulfing candle. That’s
07:39 - why we wait for the candle to
close before taking any action. Once the candle closes and there’s
a green arrow, we enter the trade. For this strategy, we’ll set a stop loss at
twice the length of the entry candle. Then, we’ll set our take profit at a 2:1 ratio relative
to the stop loss. It’s that straightforward. And just like that, the price hits our target!
If you’re someone who tends to get anxious,
07:60 - exits trades too early, or second-guesses
your decisions, here’s a valuable tip: set your take profit, set your stop
loss, step away from the screen, and let the strategy do its job. Trust
the process and let it work for you. This approach helps you avoid emotional trading,
like selling too early or, even worse, getting greedy and moving your take profit. It instills
discipline and keeps you focused on the strategy.
08:23 - It’s also important to understand that you
won’t be trading every day with this strategy. Since we’re only trading with the trend, the
chart won’t always be in a trending phase. There will be days when the market simply
doesn’t meet the criteria for a trade. And that’s okay. The key is recognizing that this
is part of the process. You’ll only trade when the market aligns with your strategy, ensuring
you’re working with the market—not against it.
08:45 - Let’s do one more example to tie it all
together. First, we check if the price is above the 200-period line. That’s our first
confirmation, and in this case, it checks out. Next, we look at the RSI to make sure it’s above
the 50 line, and it is—so we’re good there too. Now, we also spot a bullish divergence on the
RSI. While this isn’t a requirement, it’s a great bonus and increases the chances of this being a
winning trade. So far, everything’s looking solid.
09:09 - Then, we notice a candle
with a green arrow under it, which means it’s a bullish engulfing
candle. The key here is to wait for that candle to close before doing anything.
Once it closes, we enter the trade. From here, it’s straightforward: We set our stop loss to two times
the length of the engulfing candle.
09:26 - We set our take profit to
a 2:1 profit-to-risk ratio. And now, we simply wait. The price eventually
moves up, hits our take profit target, and we exit the trade successfully. Easy to follow, right?
That’s the power of a well-structured strategy! Now, to wrap things up, let’s go over a
quick summary of the strategy we presented: First, identify the trend using the
200-period EMA. For long trades,
09:50 - the price must be above the EMA,
indicating an uptrend. For short trades, the price must be below the
EMA, signaling a downtrend. Next, check the RSI momentum. For longs, the
RSI line must be above the midline. For shorts, it must be below the midline. This ensures
you’re trading with momentum in your favor. Then, look for a confirmation candle. For longs,
find a bullish engulfing candle. For shorts,
10:15 - spot a bearish engulfing candle. This provides
the final green light for entering the trade. Finally, apply proper risk management.
Set your stop loss and take profit using a 2:1 risk-to-reward ratio,
and let the strategy play out. Stick to these steps consistently for
high-probability setups in any market. In conclusion, this strategy highlights how
clear, disciplined rules can drive consistent
10:38 - trading results. By combining the 200-period EMA,
RSI for momentum, and engulfing candle patterns, you have a trend-following approach that
works across markets and time frames. Patience and discipline are key. This strategy
keeps you focused on high-probability setups, trading only when the market aligns with your
rules. Trust the process, refine your execution, and let the strategy work
without emotional interference.
11:03 - If you found this helpful, check out our other
videos and visit our website for more insights. Thanks for watching, and see you in the next video
here at ComLucro! Best of luck in your trades!!! I hope you enjoyed today's video. If you found
the content useful or fun, please give it a like, as this helps the video reach more traders like
you. Remember to subscribe to the channel and activate notifications to stay updated with the
latest financial market information and trading
11:30 - tips. Sharing this video with your
friends or on your social networks can make a big difference and helps
our community become stronger. Your support allows us to continue
bringing high-quality content, helping you make more informed decisions in the
markets. Thank you for watching and good trading!
