How to Use Bollinger Bands and RSI for Profitable Trades
📊 Bollinger Bands + RSI Strategy: Master High-Probability Trade Setups!
Welcome back to the ComLucro Channel! 🚀 Today, we’ll show you a powerful strategy combining Bollinger Bands and RSI to pinpoint trade opportunities with confidence. Perfect for beginners and seasoned traders, this approach helps you avoid false signals and improve your trading success.
We’ll walk you through:
✅ How to set up Bollinger Bands with optimal settings
✅ Adjusting RSI for precision entries (levels 25 and 75)
✅ Spotting key reversals using divergence
✅ Avoiding pitfalls during sideways markets 🚨
Learn how mean reversion works and discover practical examples that illustrate step-by-step execution. This strategy will give you an edge in navigating volatile markets.
🔗 Explore more on our website: https://www.comlucro.com.br/
📚 Free trading courses available now!
💡 Other videos to elevate your trading:
🔹 Wyckoff Method Course – Master market behavior
🔹 Smart Money Concepts – Trade like institutions
🛠 Tools we use:
TradingView – https://www.tradingview.com/?aff_id=119375
🔔 Subscribe for more strategies that work: https://comlucro.com.br/youtube
👍 If you found this video helpful, like, share, and comment your thoughts below!
Best of luck in your trades! 📈
#TradingStrategy #BollingerBands #RSI #TechnicalAnalysis #TradingForBeginners #DayTrading #MeanReversion #TradingTips #StockMarket #ComLucro
00:00 - Hello trader!!! Welcome back
to the ComLucro Channel!!! Today, we’re excited to share an
incredible strategy we’ve discovered, combining Bollinger Bands and RSI to help
traders pinpoint high-probability setups with precision. Whether you’re new to trading
or already have experience, mastering these two indicators can give you a serious edge and
transform the way you navigate market conditions.
00:20 - Here at ComLucro, our mission is clear: to
provide you with practical, no-nonsense strategies and techniques that help you become a more
confident and disciplined trader. No gimmicks, no shortcuts—just actionable
insights you can trust. In this video, we’ll not only break down the
basics of Bollinger Bands and RSI but also show you how to pair them to build a highly effective
trading strategy. You’ll learn how to identify
00:44 - optimal entries, avoid common pitfalls, and
maximize your potential in any market scenario. Be sure to check out our other videos
and free courses on the channel, like the Wyckoff Method Course and Smart
Money Concepts. Don’t forget to visit our website for even more resources to
take your trading to the next level. After this quick intro, we’ll
jump straight into the world of
01:02 - Bollinger Bands and unlock their
full potential—so stay tuned! Hey traders! If you're looking to level up
your trading game, give this video a thumbs up, subscribe to the channel, and hit that
notification bell so you never miss an update. Before we dive in, we highly recommend checking
out our playlists on trading psychology and risk management. These videos can significantly help
you manage emotions, maintain discipline, and
01:27 - develop effective risk management strategies—key
elements for achieving profitability in trading. Please, listen and remember! No amount
of study to find the perfect trading strategy will benefit you if you lack
emotional control during your trades. If you cannot accept a losing trade and
keep moving your stop loss, or worse, trade without a stop loss, you are
setting yourself up for failure.
01:50 - The efficiency of your strategy is directly
tied to your risk management and emotional discipline. Only when a trader understands and
implements this can they start seeing consistent profits and end their months in the green.
Without these critical elements, even the best strategies will crumble under poor execution and
emotional decision-making. Now, let's get started! Let’s start by setting up the Bollinger
Bands. If you’re new to using Bollinger Bands,
02:18 - you’ve made the right choice clicking on
this video because this indicator is a game-changer for identifying key support and
resistance levels in the market. To begin, open your charting platform—whether
it’s TradingView or any other tool you prefer—click on the indicators
tab, and search for "Bollinger Bands." The default settings on TradingView
are fine, but for this strategy,
02:38 - we’ll need to make some adjustments. First, go
to the length section and set the value to 30. Make sure the standard deviation remains at
2. After that, I personally like to remove the background shading from the indicator
and change the lines to red. This step is entirely up to your personal preference, so
feel free to customize it as you see fit. Now, if you’re unfamiliar with how
Bollinger Bands work, here’s a quick
02:60 - breakdown. The center line represents a
moving average, calculated by going back over a defined number of candlesticks—30
in this case—and averaging their values. The upper and lower lines indicate the standard
deviation, which helps measure price volatility. Now that the Bollinger Bands are set up, let’s
move on to adding the RSI. Open your indicators tab, type in "RSI," and select the option labeled
"Relative Strength Index." Once the RSI is added
03:26 - to your chart, we’ll make a few adjustments to its
settings. Set the upper band to 70 and the lower band to 30. By default, the length is usually
14, but for this strategy, we’ll change it to 13. For those unfamiliar with the RSI,
it’s a highly effective tool for determining whether an asset is overbought
or oversold. When the RSI line is above 70, it indicates that the asset is overbought,
meaning it might be due for a pullback. When
03:51 - the line is below 30, it signals that the asset
is oversold, suggesting a potential rebound. Now it’s time to combine these two indicators and
start spotting profitable trade opportunities. Stick around, because later in this video,
I’ll share a crucial tip that can take this strategy from being just decent to
becoming a powerful money-making tool. There are two main strategies we can use with
these indicators, both grounded in the concept
04:15 - of mean reversion. If you’re not familiar with
this term, here’s a quick explanation: "Mean" refers to the average price, while "reversion"
means moving back toward it. In simple terms, mean reversion is the idea that, after
significant price movements, the market tends to return to its average level. This is the core
principle behind the strategies we’ll explore. Let’s look at an example. After an extreme price
movement in one direction—either up or down—it’s
04:41 - common to see the price eventually return to
the average, which in this case is the moving average. If the price moves above the upper
Bollinger Band, that’s a signal to consider entering a short trade. If it moves below
the lower Bollinger Band, it’s a signal to consider entering a long trade. Sounds simple,
right? But if you were to rely solely on this, the chances are it wouldn’t work consistently.
That’s exactly why we’ve added the RSI to the mix.
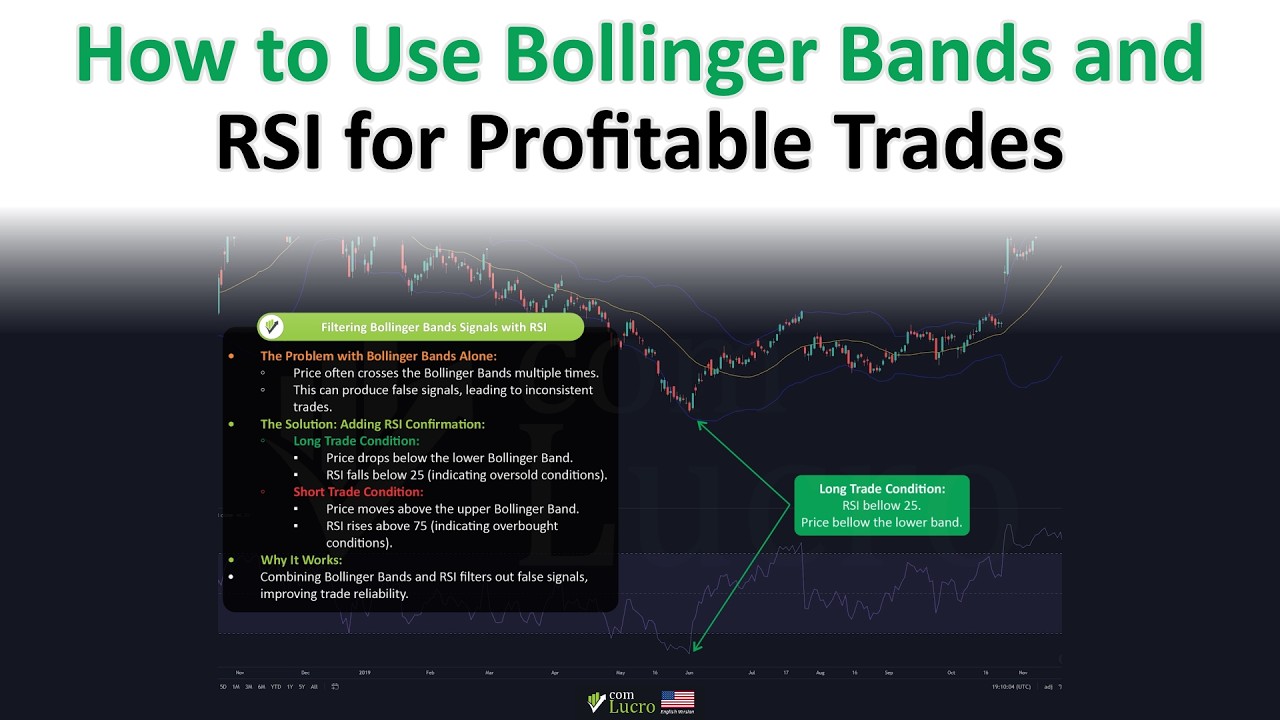
05:05 - Here’s why: the price often moves above or
below the Bollinger Bands multiple times, which can lead to many false signals. If
you entered a trade each time this happened, you’d likely lose money. To
filter out these false signals, we’ve added a crucial condition—only trade
when the RSI reaches an extreme value. Specifically, enter a long trade only
when the price drops below the lower
05:26 - Bollinger Band and the RSI falls below 25.
Similarly, enter a short trade only when the price moves above the upper Bollinger
Band and the RSI rises above 75. This additional layer of confirmation helps
improve the reliability of your trades. Here’s an example using Apple. The price
dips below the lower Bollinger Band, but the RSI hasn’t yet hit our target
level. So, we hold off. A bit later,
05:49 - the RSI drops below 25, even
reaching 20. At that point, we enter a long trade, and as anticipated,
the price eventually returns to the average. Now, there’s a critical detail you need
to understand for this strategy to work effectively. Without this insight, you risk
losing money. The main challenge comes when the market is moving sideways. During these
periods, predicting price movements becomes
06:11 - significantly harder, and the usual
signals can lead to unreliable trades. Here’s an example where things can go wrong.
The price drops below the lower Bollinger Band, and the RSI falls below 25, yet
the price continues to decline. If you entered a trade here,
you’d face a significant loss. To avoid situations like this, here’s a helpful
trick. Notice how in this example the Bollinger
06:33 - Bands are extremely narrow, closely hugging
the price. The RSI is also relatively flat, staying within a tight range inside the purple
rectangle without hitting any major extremes. This is a clear warning sign. When the market
behaves like this for an extended period, any breakout is likely to carry strong
momentum in one direction. In these cases, it’s best to avoid trading and resist the
temptation to "catch a falling knife."
06:56 - Here’s another way to refine this
strategy. Take a look at this example: the price drops to the lower Bollinger Band
and bounces back. The next time it moves down, it forms a new lower low. However, here’s where it
gets interesting—the RSI forms a higher low. This is called divergence, and it’s a powerful signal
to enter a trade. Divergence is especially strong if the RSI was previously below 25 and the price
had already touched the lower Bollinger Band. When
07:24 - you see this setup, there’s a high probability
the price will reverse and make a higher high. In conclusion, combining Bollinger Bands
and RSI provides a powerful strategy for identifying high-probability trades,
especially when spotting key setups like divergence. By mastering this
approach and applying it consistently, you can significantly enhance your
trading accuracy and confidence.
07:44 - Don’t forget to take advantage of the free
courses available right here on our channel. Whether you want to understand market
behavior with the Wyckoff Method Course, build a strong foundation with the
Technical Analysis for Day Traders Course, or dive into the mindset of institutional
traders with the Smart Money Concepts Course, we have resources to help you sharpen
your skills and elevate your trading game.
08:05 - Wishing you success in your trading journey,
and as always, best of luck in your trades! I hope you enjoyed today's video. If
you found the content useful or fun, please give it a like, as this helps
the video reach more traders like you. Remember to subscribe to the channel and
activate notifications to stay updated with the latest financial market information
and trading tips. Sharing this video with
08:27 - your friends or on your social networks
can make a big difference and helps our community become stronger. Your support allows
us to continue bringing high-quality content, helping you make more informed decisions in the
markets. Thank you for watching and good trading!
