How to Use Technical Indicators to Enhance Your Trading #TechnicalIndicators #trading #RSI #bitcoin
📈 How to Use Technical Indicators to Enhance Your Trading 📈
Indicadores Técnicos: Como Usar e Melhorar Sua Lucratividade no Trading
Welcome to the ComLucro channel, where we empower traders with the knowledge they need to excel. In today’s video, we dive deep into how technical indicators such as moving averages, RSI, and Bollinger Bands can elevate your trading precision. Whether you’re a novice or an experienced trader, this video will provide insights on how to choose the right indicator that suits your trading style and help you make more informed market decisions.
👉 Key Highlights:
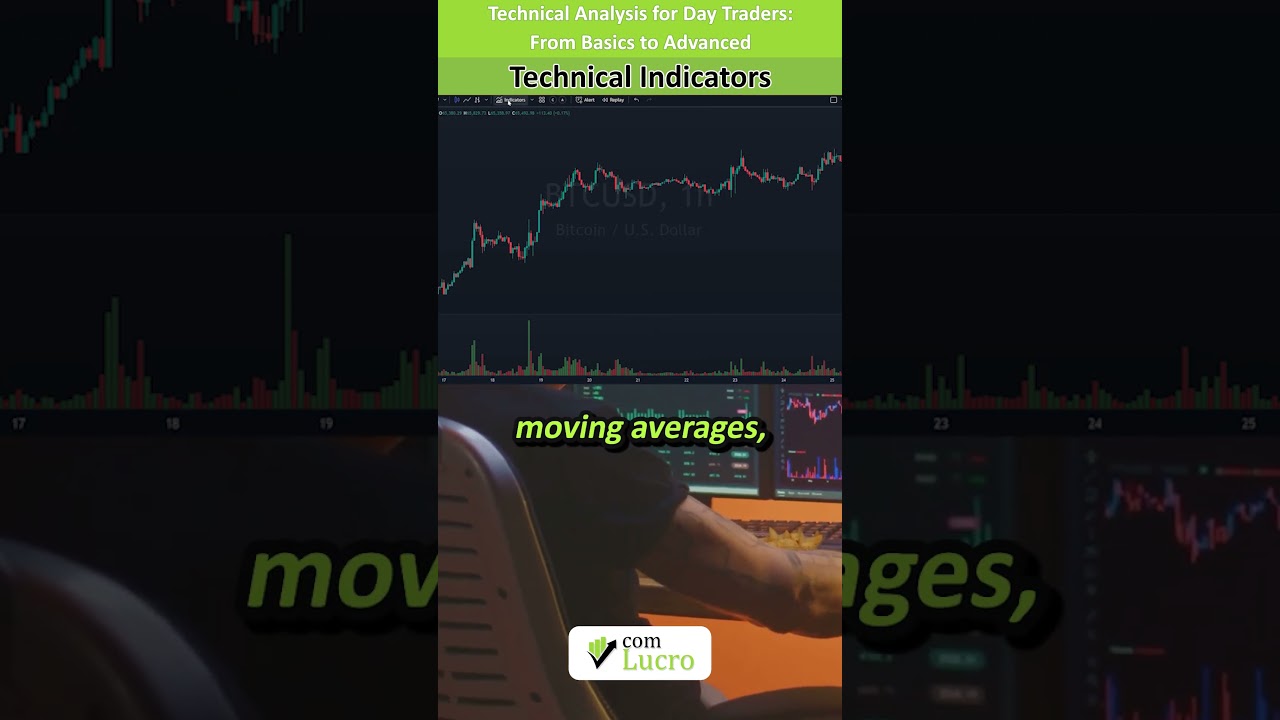
Understanding Moving Averages: How they smooth out price data for better clarity
RSI and Its Uses: Spotting overbought and oversold conditions in the market
Bollinger Bands: Identifying price volatility and potential breakout points
Choosing the Right Indicator: Tailoring tools to fit your unique trading approach
Examples and Practical Applications: See the indicators in action for real market scenarios
Tools Recommended:
TradingView – https://www.tradingview.com/?aff_id=119375
Join us as we explain how these powerful tools can help you stay ahead of the market and improve your trading success!
Subscribe: Don’t miss our upcoming videos!
Notification Bell: Stay updated with the latest trading strategies!
Like and Share: Help us grow and reach more traders like you!
Comment Below: Share your thoughts or ask questions – we love hearing from you!
💬 Connect with Us:
Trading: https://www.comlucro.com.br/
Twitter: https://twitter.com/canalcomlucro
🔔 Subscribe to stay updated with our latest episodes and take your trading to the next level!
#TechnicalIndicators #MovingAverages #RSI #BollingerBands #TradingStrategies #ComLucro #MarketAnalysis #TradingPrecision #StockMarket #InvestmentTools #PriceTrends #MarketVolatility #TradingView
00:00:00,399 --> 00:00:04,720
hey Traders want to learn how technical
00:00:02,679 --> 00:00:07,520
indicators can improve your trading
00:00:04,720 --> 00:00:10,320
decisions in today's video we explain
00:00:07,520 --> 00:00:12,440
how tools like moving averages RSI and
00:00:10,320 --> 00:00:15,240
Ballinger bands help you interpret the
00:00:12,440 --> 00:00:16,880
market with Precision curious about how
00:00:15,240 --> 00:00:19,240
to choose the right indicator for your
00:00:16,880 --> 00:00:21,519
trading Style watch the full video on
00:00:19,240 --> 00:00:23,439
the Comm lukro Channel don't forget to
00:00:21,519 --> 00:00:27,560
subscribe for more trading tips and stay
00:00:23,439 --> 00:00:27,560
ahead of the market see you there
Perguntas Respondidas por esse Artigo
-
O que são indicadores técnicos e como eles podem melhorar minha negociação?
-
Quais indicadores técnicos são abordados no vídeo?
-
Como as médias móveis podem ajudar na análise técnica?
-
O que o RSI (Índice de Força Relativa) indica?
-
Como as Bandas de Bollinger podem ser usadas na negociação?
-
Como escolher o indicador técnico certo para o meu estilo de negociação?
-
Qual ferramenta é recomendada para análise técnica?
