Master Fractal Price Action: Higher vs. Lower Timeframes!
🕵️ Did you know that a single candlestick on a higher timeframe can reveal an entire chart pattern on a lower timeframe?
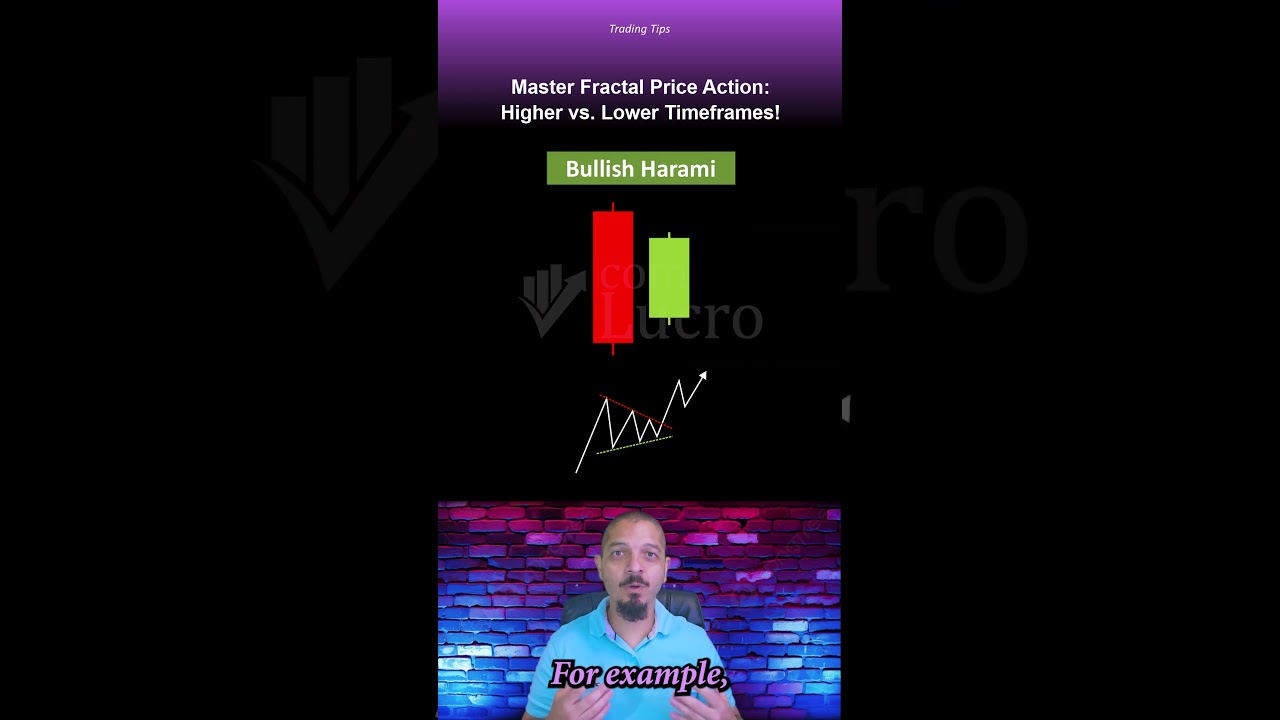
This happens because price action is fractal—meaning that what appears as a simple candle on a daily chart can actually break down into complex structures like flags, pennants, or wedges when viewed on smaller timeframes.
📊 Examples:
✅ A Bullish Harami on the daily chart could be a bullish pennant or a falling wedge on a lower timeframe.
✅ A Bearish Pinbar might represent a head and shoulders pattern, signaling a potential reversal.
🔎 Why does this matter?
Helps you spot trends early
Refines your trade entries
Improves your confirmation strategies
👀 Next time you see a strong candlestick pattern, zoom in and analyze what’s happening on lower timeframes. You might just uncover a game-changing setup!
📈 Want to master price action trading? Subscribe now for more insights!
📺 YouTube: https://comlucro.com.br/youtube
🌐 Website: https://www.comlucro.com.br/
📊 TradingView: https://www.tradingview.com/?aff_id=119375
#Trading #CandlestickPatterns #PriceAction #FractalTrading #TechnicalAnalysis #Forex #DayTrading #SwingTrading #StockMarket #CryptoTrading #ChartPatterns
00:00:00,080 --> 00:00:04,080
Trader did you know that a Candlestick
00:00:02,120 --> 00:00:06,000
pattern on a higher time frame can
00:00:04,080 --> 00:00:08,320
represent an entire chart formation on a
00:00:06,000 --> 00:00:10,599
lower time frame this is because price
00:00:08,320 --> 00:00:12,880
action is fractal what looks like just
00:00:10,599 --> 00:00:14,519
one candle pattern on a daily chart can
00:00:12,880 --> 00:00:17,000
break down into a full structure when
00:00:14,519 --> 00:00:18,960
analyzed on smaller time frames for
00:00:17,000 --> 00:00:20,800
example a bullish harami on the daily
00:00:18,960 --> 00:00:23,080
chart might actually be a bullish
00:00:20,800 --> 00:00:25,000
pennant or a falling wedge when viewed
00:00:23,080 --> 00:00:27,480
on a lower time frame signaling a
00:00:25,000 --> 00:00:29,359
potential continuation likewise a
00:00:27,480 --> 00:00:31,480
bearish pin bar could represent a head
00:00:29,359 --> 00:00:32,520
and shoulders information indicating a
00:00:31,480 --> 00:00:34,200
possible
00:00:32,520 --> 00:00:35,879
reversal understanding how these
00:00:34,200 --> 00:00:38,280
patterns align across different time
00:00:35,879 --> 00:00:40,559
frames helps you spot Trends early
00:00:38,280 --> 00:00:42,640
refine your entries and improve trade
00:00:40,559 --> 00:00:44,480
confirmations so next time you see a
00:00:42,640 --> 00:00:46,399
strong Candlestick pattern take a step
00:00:44,480 --> 00:00:48,600
back and think what does it look like on
00:00:46,399 --> 00:00:52,440
a lower time frame please keep this in
00:00:48,600 --> 00:00:52,440
mind and best of luck in your trades
Perguntas Respondidas por esse Artigo
-
O que significa dizer que a ação do preço é fractal?
-
Como um padrão de candlestick em um timeframe maior pode se manifestar em um timeframe menor?
-
Quais são os benefícios de analisar a ação do preço em diferentes timeframes?
-
Onde posso encontrar mais informações sobre price action e padrões de candlestick?
