Mastering Bullish Divergence with RSI #trading #cryptocurrency #rsidivergence
📈 Mastering Bullish Divergence with RSI: Catching Reversals Like a Pro! https://www.comlucro.com.br/
🔔 Subscribe for the latest strategies to sharpen your trading skills! https://www.youtube.com/channel/UC4nw0IYkthSqNeaYzOzxvTw?sub_confirmation=1
Welcome to Com Lucro! In this episode, we’re breaking down the concept of bullish divergence with the RSI, a powerful tool to help you spot potential reversals in the market. Dive in with us as we cover what bullish divergence means, how to identify it, and tips to execute long entries confidently. Learn how to combine price structure, support, and resistance levels with RSI to maximize your trading edge.
👉 Key Points:
Understanding Bullish Divergence with RSI
Identifying Strong Entry Signals for Long Positions
Strategic Use of Support and Resistance Levels
Effective Stop Loss and Risk Management Tips
Building Confidence in Your Market Analysis and Entries
Join us on this journey to sharpen your divergence detection skills and take control of your trading decisions with precision. Elevate your trades with insights from Com Lucro!
🚨 Subscribe: Don’t miss our upcoming videos! 🔔 Notification Bell: Stay updated with the latest trading insights! 👍 Like and Share: Help us reach more traders just like you! 💬 Comment Below: Share your thoughts or questions; we’d love to hear from you!
💬 Connect With Us: Trading: https://www.comlucro.com.br/ Twitter: https://twitter.com/canalcomlucro
#RSIDivergence #Trading #FinancialMarkets #MarketAnalysis #TradingStrategies #RiskManagement #BullishDivergence #SupportAndResistance #ComLucro
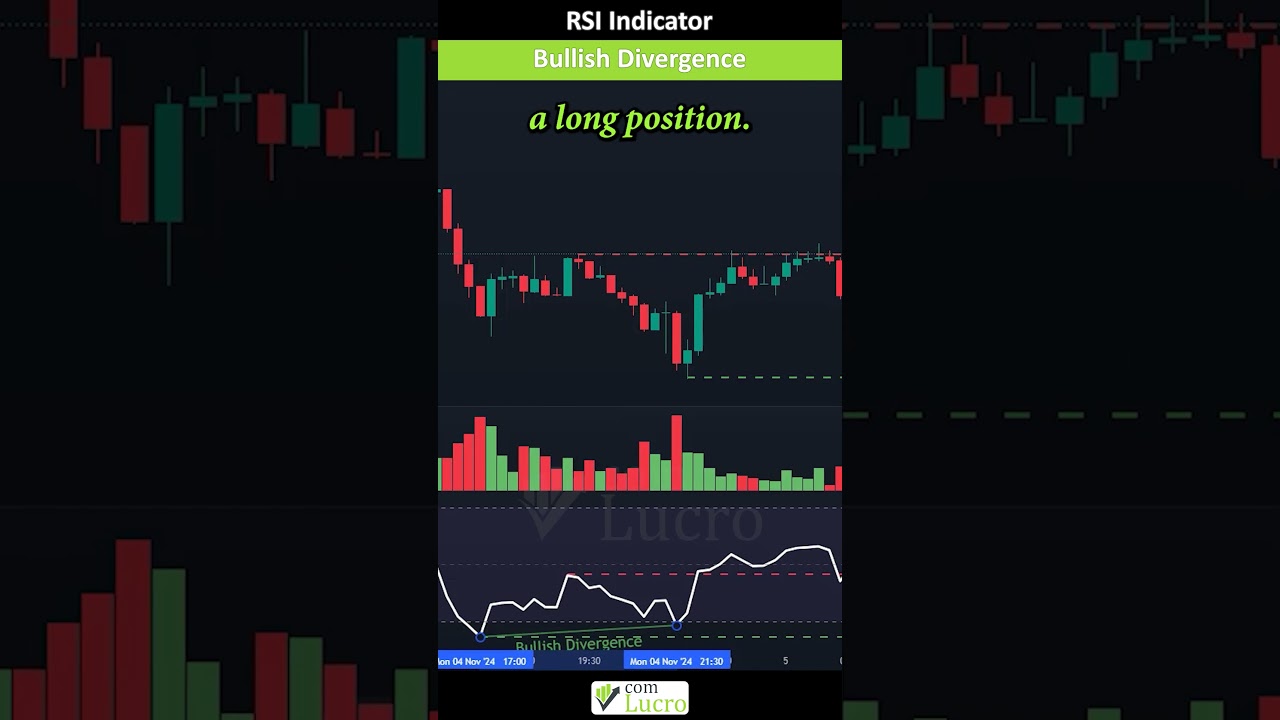
00:00 - Hey Traders! Today, we're diving into bullish
divergence with the RSI to help you catch potential reversals to the upside. When price
makes a new low but the RSI forms a higher low, that’s a bullish divergence. This signals
that sellers are losing momentum, hinting at a possible reversal. A breakout above resistance
can confirm an entry for a long position. To train your eye in identifying
price structure and RSI divergence,
00:21 - start by marking support and resistance levels
as they form. When the price breaks above the most recent resistance with a candle close and
the RSI shows a bullish divergence—meaning the price makes lower lows while the RSI makes
higher lows, indicating weakening seller momentum—you can open a long position. Set your
stop loss below the support level, with a target of at least a 1:1 risk-to-reward ratio or the
resistance high from the higher time frame.
00:45 - Here at ComLucro, we always recommend
analyzing the market structure thoroughly, backtesting your setup, keeping
efficient risk management, and, of course, always having a stop loss
in place! Best of luck in your trades!
