Stop Losing Money with RSI #trading #rsistrategy #smartmoney
📈 Stop Losing Money Using RSI Wrongly: Essential Tips for Traders!
🔔 Subscribe to stay updated with our latest episodes and boost your trading strategies!
Welcome to ComLucro! In this insightful video, we’ll help you transform your approach to the RSI indicator. Many traders rely on basic overbought and oversold levels, but this often leads to missed opportunities and losses. Today, we reveal a smarter method: using RSI divergences to anticipate market reversals. Learn how to spot these powerful signals, recognize trends, and improve your risk management for more consistent success. Perfect for traders looking to optimize their strategies, this video will enhance your understanding of market movements and help you trade with confidence. Let’s elevate your trading game with the right knowledge! 💪
👉 Key Highlights:
Common RSI Missteps and How to Avoid Them
Understanding RSI Divergences for Potential Reversals
Practical Examples of Bullish and Bearish Divergences
Importance of Market Structure, Backtesting, and Risk Management
Leveraging RSI Insights to Boost Your Trading Success
🚨 Subscribe: Don’t miss out on our next videos! Notification Bell: Stay tuned for the latest trading strategies! Like & Share: Support the channel and help us reach more traders like you! Comment Below: Share your thoughts or ask questions; we love hearing from you!
💬 Connect with Us:
Trading: https://www.comlucro.com.br/
Twitter: https://twitter.com/canalcomlucro
#TradingTips #RSI #DivergenceTrading #MarketReversals #ComLucro #RiskManagement #TechnicalAnalysis #TradingStrategies #BullishDivergence #BearishDivergence #StopLoss #MarketStructure #TradingEducation
00:00 - Attention, Traders!!! Stop losing money
trading with the RSI like this right now! Many traders rely on the RSI to spot overbought
or oversold markets. If the RSI rises above 70, it's deemed overbought; if it falls below 30, it's considered oversold. Here's the issue:
while this method occasionally works, you've likely found it doesn't consistently deliver
profitable results. In a strong downtrend,
00:20 - for instance, the RSI might indicate oversold
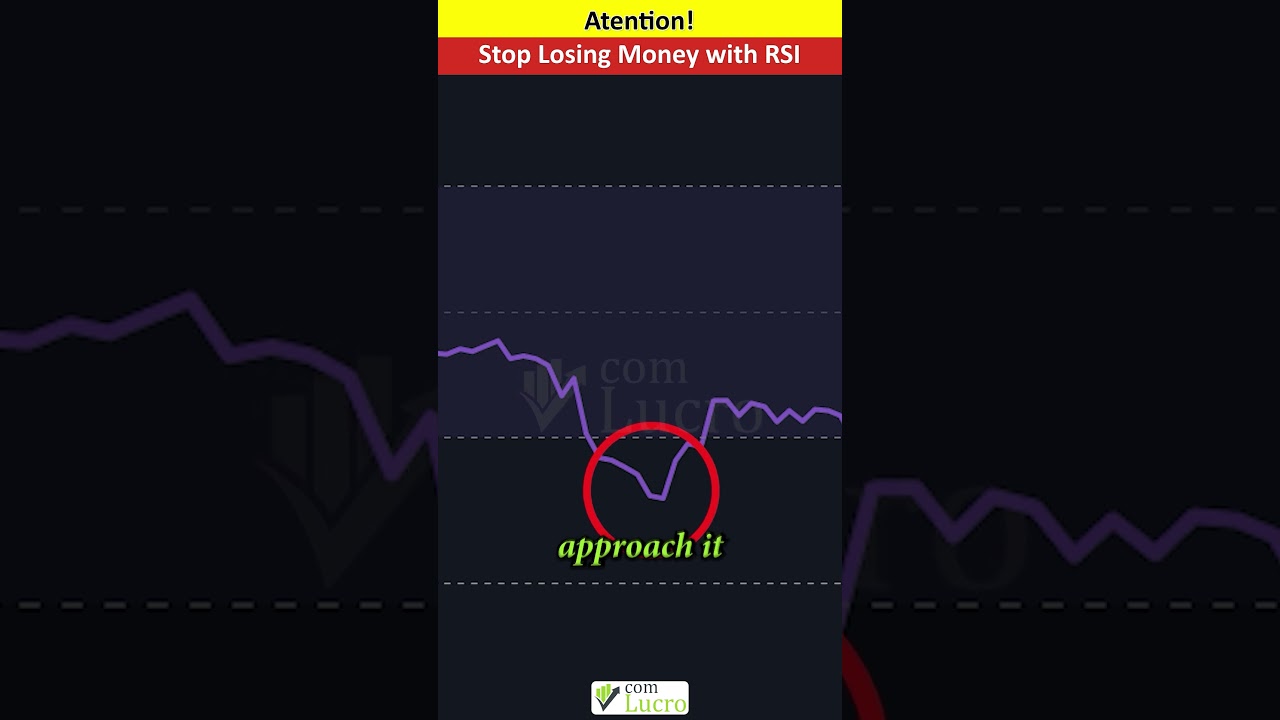
conditions, yet the price continues to drop. Instead of using the RSI this way, you should
approach it differently. The RSI can reveal divergences—situations where the price moves
in one direction while the indicator moves in another. Traders can use these divergences to
pinpoint potential market reversals. For example, if the market is trending downward but the
RSI is making higher lows, this forms a
00:41 - bullish divergence, signaling that the market
may soon reverse upwards—which it often does. Remember! Here at ComLucro, we always recommend
analyzing the market structure thoroughly, backtesting your setup, maintaining
efficient risk management and ALWAYS having a stop loss in place!
Best of luck in your trades!
Perguntas Respondidas por esse Artigo
-
Qual é o erro comum que muitos traders cometem ao usar o indicador RSI?
-
Qual é a estratégia mais inteligente para usar o RSI, conforme explicado no vídeo?
-
O que são divergências do RSI e como elas ajudam os traders?
-
Quais são os principais tópicos abordados no vídeo para melhorar as estratégias de trading com RSI?
-
Como posso me manter atualizado com os vídeos mais recentes sobre estratégias de trading da ComLucro?
