The Perfect Support and Resistance Guide for Traders
📊 Support and Resistance: Not Just Lines — They’re Trade-Defining Levels
In this powerful chapter of our course Technical Analysis for Day Traders, we dive deep into support and resistance — two of the most important concepts in trading.
🔑 These levels help you make better decisions, spot high-probability setups, and avoid costly mistakes. But first, we explore the mindset that separates amateurs from professionals — featuring insights from Larry Williams, Charles Faulkner, and David Paul.
📌 You’ll learn:
The difference between support/resistance and supply/demand zones
How to draw key levels using horizontal lines, trendlines, moving averages, and Fibonacci retracements
The truth about false breakouts, price reversals, trading ranges, and market sentiment
The vital role of risk management
How to stay disciplined and consistent
🎯 This is more than a tutorial — it’s a practical roadmap for better trading.
🚀 Let’s elevate your strategy with structure, clarity, and confidence.
🔔 Subscribe and turn on notifications so you never miss a new trading video: https://comlucro.com.br/youtube
🛠 Recommended Tools:
TradingView – https://www.tradingview.com/?aff_id=119375
💬 Share your thoughts in the comments — and don’t forget to like the video if it helped you!
🌐 Connect with us:
Com Lucro – https://www.comlucro.com.br/
YouTube – https://comlucro.com.br/youtube
#SupportAndResistance #DayTrading #TechnicalAnalysis #TradingMindset #LarryWilliams #CharlesFaulkner #DavidPaul #PriceAction #RiskManagement #SmartMoney #BreakoutTrading #Fibonacci #TradingDiscipline
Hello, traders, and welcome back to the ComLucro channel. In today's chapter of our course Technical Analysis for Day Traders: From Basics to Advanced, we’re diving into one of the most essential concepts for any trader: support and resistance.
These aren’t just lines on a chart — they’re key decision zones. Mastering how to read and react to these areas can dramatically improve your entries, exits, and overall market confidence.
But before we explore the tools and tactics, let’s talk mindset. Because no technical level will matter if your psychology is working against you. Here’s veteran trader Larry Williams with a direct message about the kind of inner strength this business demands:
Do you have the right stuff to become a trader or an investor? Frankly, I doubt it. A dear friend of mine, Jim Irwin, was the first astronaut to drive a car on the moon. I asked him how he got selected to become an astronaut — what process they go through. He said the big tests were on how much stress we could handle, and to learn to handle stress.
They had to repeat the same function over and over. Things would change. They’d have to learn to respond to it. That’s what traders do, and investors do. We’re always responding to something that we don’t have a lot of control over — just like the astronaut. So if you don’t handle stress well, you get emotional, you respond too quickly — this is not for you.
Pack up your computer. Stop trading. You’re going to lose money. I don’t want that to happen to you. Or learn to handle stress, to stop, to think before you react. Most people that are not making money react too quickly. Instead of cooling off a little bit, thinking about it, they jump to conclusions. This is not a business where you want to jump to conclusions.
That’s exactly what support and resistance offer you: a structure to help you stop, think, and respond — not react.
So, with that mindset in place, let’s get practical.
In today’s video, we’ll break down what support and resistance really mean, why they matter so much in technical analysis, and how you can use them to refine your decision-making. We’ll explore various methods — from horizontal levels and trendlines, to moving averages and Fibonacci retracements — to help you identify where price is likely to stall, reverse, or break through.
We’ll also look at how these levels influence market behavior, including price reversals, breakout trades, and trading ranges. It’s a packed session tailored for day traders — those of you looking to maximize opportunity within the same trading day.
Let’s lock in, stay focused, and dive into the core principles that can elevate your trading game.
Because when it comes to support and resistance, understanding them isn’t just helpful—it’s what separates good trades from great ones.
Now, let’s jump in and get started.
We’re about to explore two of the most foundational concepts in technical analysis: support and resistance. These aren’t just buzzwords—they’re critical tools for any trader aiming to approach the markets with clarity, confidence, and precision.
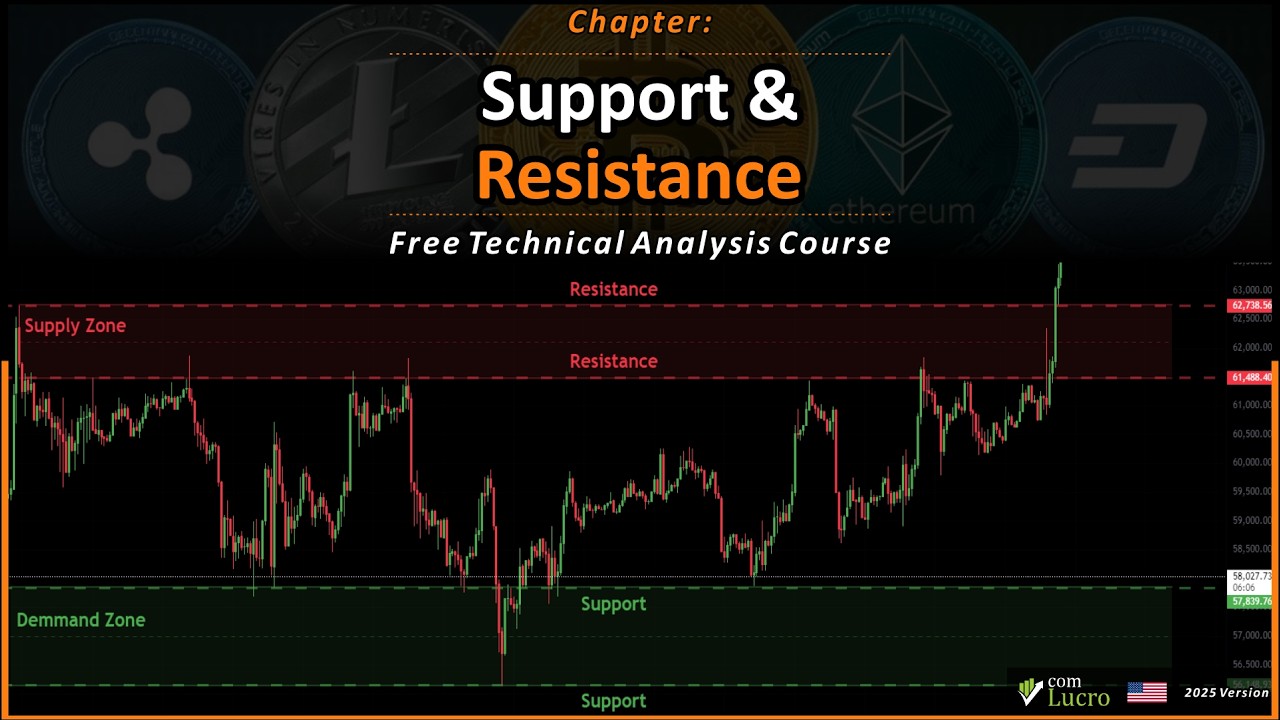
Support is a price level where a downtrend tends to pause or reverse. At this level, demand increases as buyers step in to prevent the price from falling further. Think of support as a sturdy floor beneath the price, providing a strong base that keeps the market from dropping too low.
Resistance, on the other hand, represents a price level where an uptrend tends to pause or reverse. When the price reaches this level, selling pressure builds, making it challenging for the asset to continue climbing. Resistance acts like a ceiling above the price, capping any further upward movement and signaling a potential reversal.
Now, let's distinguish between these levels and the broader zones of supply and demand.
While support is a specific point on a chart, a demand zone is a broader area where buying interest is strong enough to halt a decline. This zone covers a range of prices where buyers accumulate positions, anticipating a price reversal due to increased demand. So, while support acts as a precise safety net, a demand zone provides a wider cushion, offering protection over a broader area.
Similarly, resistance differs from a supply zone. Resistance is a defined level where the price struggles to move higher, whereas a supply zone covers a range of prices where selling pressure is significant enough to stop an upward movement. In this zone, sellers are active, expecting that the price will not easily break through.
Therefore, while resistance serves as a specific barrier, a supply zone spreads that resistance across a wider range.
However, one of the biggest mistakes traders make is assuming that the price will never break through a support or resistance area — or, conversely, believing that once a level is broken, the price will automatically continue in that direction.
It's crucial to understand that the market does what it wants, and it's not bound by any guarantees. The key to navigating this uncertainty lies in having solid risk management and emotional control.
As the saying goes, "The market can remain irrational longer than you can remain solvent" — a quote often attributed to John Maynard Keynes.
Additionally, one of the major shortcomings of many videos and materials focused solely on technical analysis is the lack of emphasis on a critical truth: trading is about probabilities, not certainties.
Success in trading doesn't come from being right all the time, but from how well you manage your trades when things don’t go as expected. That’s where risk management, emotional discipline, and patience come in — not just as optional skills, but as core elements of long-term consistency.
To reinforce that, here’s a brilliant perspective from Charles Faulkner — one of the key contributors to the Market Wizards series — on how professional traders think differently about loss and decision-making under pressure:
If you were making decisions, imagine if every decision you made was like, “Oh God, I’m making the decision. It’s really important.” You know, when you’re doing this, you’re getting all upset about this decision. I mean, does that make it a better decision? Here’s the thing: when you get into trading, a number of people have this idea that if they’re trading big amounts of money and putting on positions, therefore, it ought to be really exciting and upsetting because of all the stuff involved.
But the people who do it really well are minimizing risk. For them, it’s pretty much the same thing. Now, I understand there’s also confusion about this in terms of cutting losses. The neophyte trader, when you hear “cut your losses,” will try to cut them to zero, even if it means waiting for it to go down, waiting for it to come up again.
Right? Then it goes down, “It’ll come back because I don’t want to take a loss,” which is different from the experienced trader who’s going, “I cut my losses. I never eliminate them. I just keep cutting them and cutting them and cutting them.” So the idea is you never eliminate risk; you’re minimizing risk.
To dive deeper into this concept, check out the video that will appear in the card about liquidity from our Smart Money course. Although it’s more advanced for this stage of the course, it’s valuable to watch and start thinking about these concepts now.
Moving on, let’s continue by diving into the various techniques traders use to identify support and resistance levels. We’ll explore each method in detail, starting with the simplest approach and moving on to more advanced techniques.
Before you begin identifying these levels, it’s crucial to start by analyzing higher time frames and then work your way down. For day traders, this means starting with the weekly chart, then moving to the daily, hourly, 15-minute, and finally the 5-minute chart.
This approach is essential because support and resistance areas on higher time frames tend to hold greater significance and can strongly influence price action on lower time frames.
However, to keep this video more focused and efficient, we’ll demonstrate the drawing of these levels using a single time frame.
Now, let’s identify and draw these levels.
Begin by locating key reversal points on your chart. These are the areas where the price has repeatedly changed direction. Using the horizontal line tool in TradingView, draw a line at the price point where the market has consistently reversed upward to mark your support level. Similarly, identify where the price has struggled to move higher and place another line there to indicate resistance.
It’s important to refine these lines as you move to lower time frames, adjusting them slightly if necessary to capture the most accurate levels of support and resistance. You can also label these lines for clarity — add labels like “Support” or “Resistance.”
By following this top-down approach and focusing on key levels across multiple time frames, you’ll gain a clearer understanding of market dynamics, allowing you to make more informed trading decisions.
Now, moving on to trend lines. To draw trend lines, start by identifying the highs and lows of price movements on your chart.
To create an upward trend line, connect a series of higher lows. This line will act as a support level, indicating where the price is likely to find buying interest as it rises.
Conversely, to draw a downward trend line, connect a series of lower highs. This will serve as a resistance level, showing where selling pressure typically emerges during a decline.
These trend lines are particularly valuable in trending markets, as they help you visualize the overall direction and momentum of the price. Make sure to adjust the lines as needed to accurately reflect the key turning points in the market.
By following these steps, you’ll have a clear view of the trend, aiding in your trading decisions.
Next, let’s discuss moving averages.
Moving averages — particularly the 20, 50, and 200-period averages — can act as dynamic support or resistance levels. To begin, apply the moving average indicator to your chart, selecting the desired period.
When the price is above the moving average, it often serves as a support level, indicating that the price is likely to find buying interest if it approaches the average.
Conversely, when the price is below the moving average, it can act as a resistance level where selling pressure may occur as the price rises towards the average.
Traders often rely on these moving averages in trending markets to identify key levels where the price might react — helping to guide entry and exit points.
Adjust the period of the moving average to suit your trading style and time frame, ensuring it aligns with the market conditions you're analyzing.
Moving on to psychological levels.
Round numbers — such as 100 or 1,000 — often act as significant support or resistance levels. These levels are important because they attract the attention of many traders, who tend to place buy or sell orders around these figures.
This concentration of orders can lead to increased buying pressure when the price approaches a psychological support level, or heightened selling pressure when it nears a psychological resistance level.
Recognizing these key levels can help you anticipate potential market reactions and adjust your trading strategy accordingly.
Finally, let's look at Fibonacci retracement levels. These levels, calculated based on the Fibonacci sequence, are key areas where price retracement might occur within a trend. Common Fibonacci levels, such as 38.2%, 50%, and 61.8%, are widely used by traders to identify potential support and resistance points.
To apply Fibonacci retracement, select the tool in your charting software — like TradingView — and draw it from the start of a trend (a significant high or low) to the end of the trend. The resulting horizontal lines at the Fibonacci levels will indicate areas where the price might pause or reverse during a pullback.
These levels are especially useful for anticipating where the price might find support or resistance as it retraces within a trending market, helping you make more informed trading decisions.
As you've noticed, there are various ways to draw support and resistance on your charts, and this can often complicate and hinder the learning process. Many beginner traders find themselves jumping from one method to another, which can lead to confusion and inconsistency.
The key is to understand how each method works and then decide which approach best fits your trading strategy. We strongly recommend that you avoid cluttering your chart with multiple support and resistance lines, trend lines, Fibonacci levels, and moving averages all at once. Doing so can make your chart overwhelming and difficult to interpret.
The goal of this video is to introduce you to the different possibilities that trading offers so you can explore them. It's important to note that in future chapters of our course, we will dive deeper into specific strategies for what we consider to be the best ways to trade using support and resistance.
But before we move on, here’s a perspective from David Paul — a mechanical engineer turned trader — that perfectly captures why clarity and simplicity matter so much in your trading approach:
I have a Ph.D. in mechanical engineering. I think in trading, you need two things: you need information, and you need self-awareness. And certainly, my background as an engineer has helped put those information channels into place. I think that when that’s in place, it becomes quite a small part of the puzzle. And self-awareness is everything. And there’s enough—a lot of trading psychologists around these days.
In fact, I think there’s probably more trading psychologists than there are traders. But it’s really, really important that you get those two little facets in place: information and self-awareness. So that has certainly helped in the first.
With that in mind, now, let's continue by exploring how support and resistance levels play crucial roles in various market scenarios.
First, let's discuss price reversals. These are key moments where the price changes direction, often occurring at support or resistance levels. When the price approaches a support level, it may bounce back up, signaling a potential reversal of the downtrend. Similarly, when the price nears a resistance level, it might reverse downward, indicating the end of an uptrend.
To identify these reversals, traders often look for specific patterns, such as double tops or double bottoms. A double top at a resistance level suggests that the price is struggling to break higher and may soon decline. Conversely, a double bottom at a support level indicates that the price is finding it difficult to fall further and might start rising.
By recognizing these patterns and understanding how price reversals work, you can better anticipate market movements and make more informed trading decisions.
Now let's consider trading ranges. In a sideways or consolidating market, prices tend to move within a well-defined range bounded by support and resistance levels. During these periods, the market lacks a clear trend, and prices fluctuate between these boundaries. Traders can capitalize on this by buying when the price is near the support level and selling when it approaches the resistance level — taking advantage of the predictable price movements within the range to generate profits.
Next, let's move on to breakouts. A breakout occurs when the price pushes through a support or resistance level, often resulting in significant price movements. When the price breaks above a resistance level, it can signal the beginning of a new uptrend, suggesting that buyers are gaining control and the market is likely to rise further. On the other hand, a breakdown below a support level might indicate the start of a downtrend, with sellers taking charge and the price expected to fall.
Traders typically view these breakouts as opportunities to enter trades, anticipating that the price will continue in the direction of the breakout. By understanding and identifying breakouts, you can capitalize on these shifts in market momentum.
Moving forward, let's talk about false breakouts. Sometimes, the price may temporarily move beyond a support or resistance level, only to quickly reverse back within the range. These false breakouts — also known as springs, liquidity sweeps, or stop hunts — can trap traders who anticipated a sustained move, leading to premature entries or exits.
It's crucial to recognize the signs of a false breakout to avoid being caught in these deceptive moves and to ensure that your trading decisions are based on more reliable signals.
Now let's discuss risk management. Effective risk management is essential for successful trading and is closely tied to support and resistance levels. Traders often place stop-loss orders just below support or above resistance levels to protect themselves from unexpected price movements. By setting these stops strategically, you can limit potential losses and ensure a controlled exit if the market moves against your expectations.
This approach not only helps to define your risk but also allows you to trade with greater confidence, knowing that your downside is managed.
Finally, let's touch on market sentiment. The interaction between price action and support and resistance levels provides valuable insights into overall market sentiment. If the price repeatedly tests a support level without breaking it, this could indicate strong buying interest and bullish sentiment. Conversely, if the price struggles to break through a resistance level, it may suggest dominant selling pressure, signaling bearish sentiment.
Understanding this dynamic helps you gauge the market's mood and adjust your trading strategies accordingly.
In conclusion, mastering support and resistance is a foundational skill that can significantly enhance your trading decisions. Whether you're identifying key levels for price reversals, navigating breakouts, or managing risk, understanding these concepts is crucial for success.
We’ve covered different methods to identify levels—like trend lines, moving averages, and Fibonacci retracements. The key is to keep your charts clean and use the tools that fit your strategy.
As you refine your approach, remember trading is about probabilities. Combining technical analysis, risk management, and market sentiment will help you make informed decisions and succeed.
To wrap up, here’s a powerful reflection from David Paul, on the kind of discipline it takes to apply what you’ve learned, and how real consistency comes from transforming good practices into second nature:
I think that you can build discipline in any field that you want to sort of work at. It takes repetition. And I go to the gym every day. I have absolutely no idea why I go to the gym every day at 61, but nevertheless, it doesn’t take any discipline for me to go to the gym every single day.
And the great paradox, of course, is that when you’ve got discipline, you don’t need it. So it just happens. You can build discipline relatively easily, and in some of the training courses I’ve done over the years, we have a discipline-building exercise, which is all about getting your teeth and following a trading system for about 30 trades.
It takes about 30 trades to instill that discipline. And I’m reasonably disciplined in most things. There are certainly things that I need to work on, that’s for sure. But I firmly believe that anybody can develop the discipline to be a consistently winning trader, but very few do.
Discipline, as David points out, is not about willpower—it’s about repetition and commitment. So, as you put these concepts into practice, remember: success comes from doing the right things over and over again.
I hope you enjoyed today’s video. If you found the content useful or fun, please give it a like, as this helps the video reach more traders like you. Remember to subscribe to the channel and activate notifications to stay updated with the latest financial market information and trading tips.
Sharing this video with your friends or on your social networks can make a big difference and helps our community become stronger. Your support allows us to continue bringing high-quality content—helping you make more informed decisions in the markets.
Thank you for watching, and good luck on achieving excellent results in your trades.
Perguntas Respondidas por esse Artigo
-
O que são suporte e resistência no trading?
-
Qual a diferença entre suporte/resistência e zonas de oferta/demanda?
-
Como traçar níveis de suporte e resistência?
-
O que devo saber sobre falsos rompimentos (false breakouts)?
-
Qual o papel do gerenciamento de risco no trading?
-
Como posso manter a disciplina e consistência no trading?
