The Strategy That Made Larry William $1.1 Million In 12 Months
📈 Larry Williams’ Trading Masterclass: LW Volatility Breakout Strategy Explained
Hello traders! 🚀 Discover the exact strategy that turned $10,000 into $1.1 million in just 12 months! Larry Williams’ LW Volatility Breakout Strategy uses Donchian Channels, momentum indicators, and volume confirmation to spot high-probability trades. We’ve broken it down step by step, added enhancements like support and resistance levels, and revealed a secret trick to improve your win rate.
🎯 Key Takeaways:
How to Set Up Donchian Channels for optimal results
Identifying trends with momentum indicators
Filtering out false signals using volume confirmation
Secret tips to avoid losses in choppy markets
💡 Ready to transform your trading? Watch now and learn to trade smarter, not harder!
👉 Explore more tools, insights, and strategies at www.comlucro.com.br
🔔 Subscribe for exclusive trading content: YouTube Channel
🛠 Tools We Recommend:
TradingView
📣 Let’s connect:
Website: www.comlucro.com.br
Twitter: @canalcomlucro
#LarryWilliams #TradingStrategies #VolatilityBreakout #DonchianChannels #MomentumTrading #VolumeAnalysis #SmartTrading #HighProbabilityTrades #ComLucro #TechnicalAnalysis
00:00 - Hello traders! Welcome back
to the ComLucro Channel! Today, we’re diving into Larry Williams’
legendary LW Volatility Breakout Strategy—the method he used to turn $10,000 into $1.1
million in just 12 months! This isn’t just theory. We’ll break it down step by step,
showing you how to use the Donchian Channels, momentum indicators, and volume confirmations to
find high-probability trades. Plus, we’ll share a
00:23 - secret trick to make it even more effective by
integrating key support and resistance levels. At ComLucro, our goal is simple: to empower you with practical, proven strategies
that help you make smarter trading decisions. We don’t do hype or shortcuts—just solid,
actionable techniques you can trust. If you’re ready to elevate your trading game,
stick around. We’ve condensed everything you need
00:44 - into an easy-to-follow approach designed
to save you time and boost your results. And don’t forget to explore our other videos and visit our website for more tools
and resources to sharpen your edge. After this brief introduction, we’ll jump straight
into the details. You won’t want to miss them! Hey traders! If you're looking to level up
your trading game, give this video a thumbs up,
01:04 - subscribe to the channel, and hit that
notification bell so you never miss an update. Before we dive in, we highly recommend checking
out our playlists on trading psychology and risk management. These videos can significantly help
you manage emotions, maintain discipline, and develop effective risk management strategies—key
elements for achieving profitability in trading. Please, listen and remember! No amount
of study to find the perfect trading
01:31 - strategy will benefit you if you lack
emotional control during your trades. If you cannot accept a losing trade and
keep moving your stop loss, or worse, trade without a stop loss, you are
setting yourself up for failure. The efficiency of your strategy is directly tied
to your risk management and emotional discipline. Only when a trader understands and implements
this can they start seeing consistent profits
01:54 - and end their months in the green. Without these
critical elements, even the best strategies will crumble under poor execution and emotional
decision-making. Now, let's get started! First, let’s talk about Larry Williams—a renowned professional trader who accomplished the
extraordinary feat of turning $10,000 into $1.1 million in just 12 months of
trading, an astonishing 11,300% return!
02:21 - Now, if you’re anything like us, you’re probably
wondering: How in the world did he pull that off? Driven by curiosity, we at ComLucro decided
to dig deep and uncover the secret behind this incredible success. We scoured the internet,
searching for every piece of information we could find about the strategy Larry Williams
used to achieve these mind-blowing results. And let us tell you, what we found was
nothing short of amazing. We uncovered
02:46 - the exact trading strategy Larry Williams
employed to generate those massive gains. After analyzing it, we can confidently say
that Larry is a genius for developing this approach—it’s incredibly effective
and still highly relevant today. Now, here’s the best part: we’re going
to share this strategy with you. Let’s dive straight into it. The method behind these
extraordinary gains is known as the LW Volatility
03:09 - Breakout Strategy. LW, of course, stands for
Larry Williams—it just makes sense, right? So, let’s talk about how this strategy revolves
around one powerful tool—the Donchian Channels indicator. It’s the star of the show,
and here’s exactly how you set it up. First, you’ll need to add it to your chart. To
do that, head over to the Indicators tab and type in “Donchian Channels.” Once you see it
pop up, click on it—it’s this one right here.
03:33 - Now, while the default settings of the
Donchian Channels are good, we need to make a few adjustments to tailor it specifically
for this strategy. Here’s what you need to do: Open the Settings for the indicator
and change the Length to 96. This tweak is key to aligning it with
the logic behind the strategy. Then, go to the Styles tab and change the
line colors to red. This isn’t just for
03:53 - aesthetics—it makes the lines stand out, so you
can quickly and easily spot critical levels. Here’s a super important point: these settings
are specifically fine-tuned for the 5-minute time frame. That’s the exact time frame Larry
Williams used to make this strategy work. But if you’re thinking about
using a different time frame, you’ll need to do a little homework. Make sure
to run your own backtesting and experiment
04:14 - with different settings for the indicator to
find what works best for your preferred time frame. It’s all about adapting the
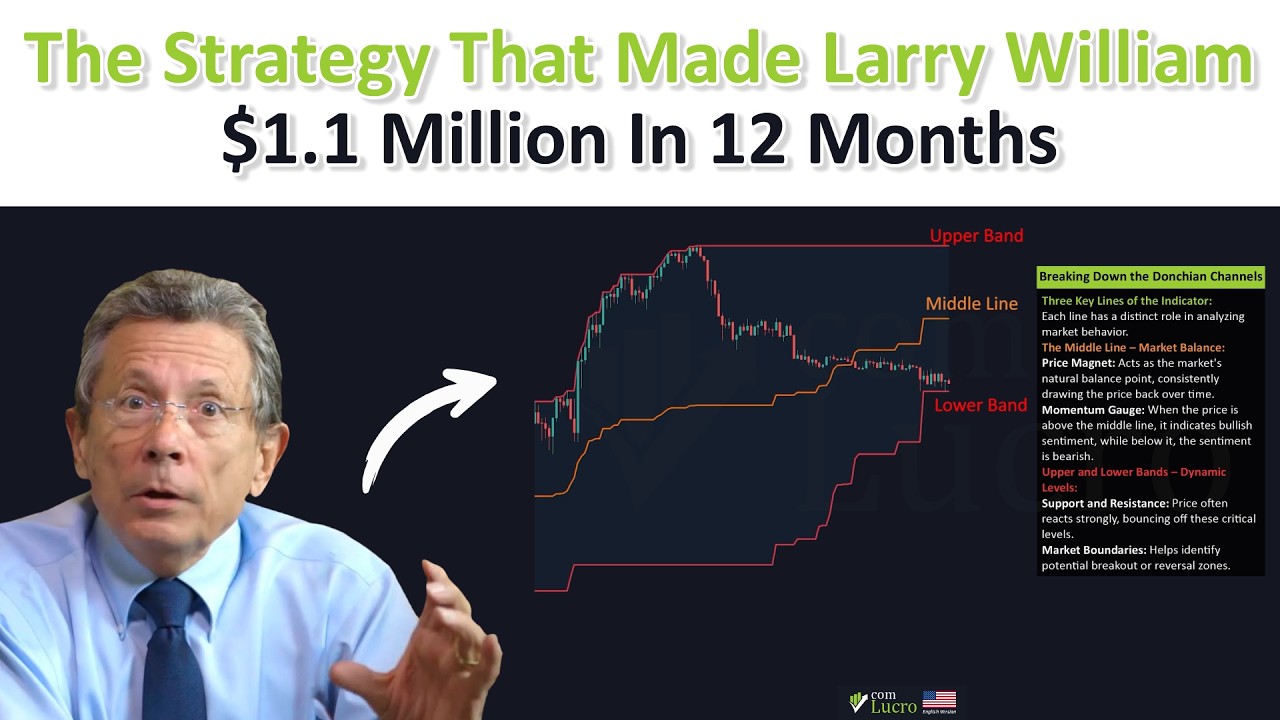
strategy to fit your trading style! Alright, so here’s what the Donchian
Channels indicator looks like when you add it to your chart. You’ll
notice it has three lines, and each one serves an important
purpose. Let me break it down for you.
04:31 - First, we’ve got the middle line. Now, think of
this as the market’s natural balance point—it’s like a magnet for price. The price tends to
be drawn back to it over time, which makes it super useful for understanding market behavior. On
top of that, it’s a great way to gauge momentum. For example, when the price is trading above
the middle line, that’s usually a bullish sign. And when the price is below the middle line,
the sentiment is more bearish. Simple, right?
04:55 - Next up are the upper and lower bands. These
lines are where things start to get interesting. They can act as really strong support and
resistance levels, meaning the price often bounces off these points. But there’s more—these
bands also play a big role in spotting breakouts. Here’s how it works: when the price breaks
above the upper band, it often signals that momentum is picking up and the price
might keep climbing. And the same goes for
05:18 - the lower band—if the price breaks below it,
that can indicate further downward movement. Now, here’s the exciting part. This idea of
breakouts? That’s exactly how Larry Williams used the Donchian Channels in his strategy. But hang
tight—we’re getting to that part in just a bit! Now, let’s address the elephant
in the room—this strategy has one major issue. Actually, it’s a pretty big
problem, so let me break it down for you.
05:41 - Here’s how the strategy is normally used:
When the price breaks above the upper band, you enter a long position. You set your
stop loss just below the middle line and your take profit to something like a
2:1 risk-to-reward ratio. Sounds great, right? And in a trending market, this
setup often results in winning trades. BUT—here’s the catch—this
06:00 - strategy runs into trouble when the market
starts consolidating and moving sideways. During consolidation, the upper and
lower bands get much closer together, like you see here. When this happens, even small
price movements with little to no momentum can cause the price to break through the bands. This
creates false signals, leading you to enter trades that don’t have a strong directional push. And
what’s the result? You end up losing the trade.
06:23 - So, while this strategy shines in trending
conditions, we need to be aware of how it performs in choppy, sideways markets. Don’t
worry though—there are ways to address this, and I’ll show you how to avoid these traps! Alright, let’s fix the issue and ensure we’re
only entering high-quality trades with real momentum behind them. To do that, we need to
add two confirmation indicators to the setup.
06:44 - First Confirmation: The Larry
Williams Large Trade Index (LWTI) This indicator helps us identify
whether significant trading activity is backing a trend. Here’s how to set it up: Add the LWTI to your chart.
Go into the Settings and change the Period to 25. A higher number looks for longer-term trends.
If you’re looking to confirm shorter-term trends,
07:05 - using a lower number might work better. However,
after thorough testing, we found that 25 is the optimal setting for the 5-minute time frame.
Next, adjust the Smoothing Period to 20. This gives us a reliable confirmation of
whether a trend is substantial or just noise. Second Confirmation: A Simple
Volume Indicator Works Wonders Alright, let’s talk about
volume. It might seem basic,
07:28 - but trust us—this tool is a game-changer for
avoiding bad trades. Here’s how to set it up: Add a Volume indicator to your chart.
Open the Settings and change the MA Length to 30. Then, switch to the Style tab,
enable the Volume Moving Average, and change its color to white
to make it easier to spot. This volume indicator will help us confirm when
the market has real momentum behind a move,
07:50 - ensuring we don’t get tricked by
small, insignificant price movements. With these two confirmations in place, we’ll filter out false signals and focus only on
trades with strong backing and clear momentum! This strategy is super straightforward, and I’ll
walk you through it step by step. Plus, stick around until the end because I’m going to share
a secret trick that makes it even more powerful!
08:10 - Alright, here’s how to set it up: First things first—make sure you’re on the
5-minute timeframe. This is crucial for the strategy to work as intended. Now, let’s
break it down into steps for a long trade: Step 1: Watch for the Price
to Touch the Upper Red Line. Wait for the price to move up and make
contact with the upper red line of the
08:28 - Donchian Channels. This is your first signal that
the market might be setting up for a breakout. Step 2: Check the LWTI Indicator.
Next, look at the LWTI indicator. It must be green when the price touches
the upper band. If it’s red, you skip the trade—simple as that. This ensures that there’s
strong directional momentum behind the move. Step 3: Confirm Volume Bars Are
Above the White Line and Green.
08:53 - Finally, check the volume indicator.
The volume bars need to be both: Above the white moving average line
(to show sufficient market activity). Green (to confirm bullish momentum).
This step is critical because it filters out trades in consolidating
markets or during low-volume periods. If all three of these criteria are
met, you’re good to go! Enter the
09:13 - trade right at the point where the
price touches the upper red line, the LWTI confirms the trend,
and the volume is aligned. Follow these steps carefully, and you’ll
be well on your way to making smarter, more strategic entries. And remember, that
secret trick is coming up next, so stay tuned! Alright, let’s talk about stop loss placement—it’s
one of the most important parts of this strategy,
09:34 - and where you put it depends on the
specific setup you’re dealing with. Most of the time, you’ll want to place your
stop loss just below the middle orange line of the Donchian Channels. This is a solid spot
because it gives your trade enough breathing room to handle normal market fluctuations
while still keeping your risk manageable. But sometimes, you’ll notice there’s a big gap
between the upper band and the middle orange
09:55 - line. In these cases, setting your stop loss
at the orange line could mean taking on way too much risk. So, what do you do? Instead,
place your stop loss at the most recent swing low. It’s still effective and keeps your
risk in check without overexposing your trade. Now that your stop loss is in place, it’s time to
think about your take profit. Here’s the golden rule: go for a 2:1 risk-to-reward ratio. Why?
Because even if your win rate isn’t super high,
10:21 - this ratio ensures you can stay
profitable in the long run. And there you have it! With both your stop
loss and take profit set, your trade is locked and loaded—structured,
calculated, and ready to roll. Let’s break down a quick example of how
this strategy works for a short trade, step by step. Stick around because after this,
10:39 - I’ll share the secret trick that can
take this strategy to the next level! First, you’re watching for the price
to hit the lower band of the Donchian Channels. This is your first signal
that a bearish move might be starting. Next, check the LWTI indicator.
It has to be red. If it’s green, hold off—this means there’s no clear bearish
momentum yet, and it’s better to stay out.
10:59 - Finally, look at the volume bars.
You need to confirm two things here: The bars should be above the white moving average
line, showing there’s enough market activity. They also need to be red,
confirming bearish sentiment. Once all three conditions are met, you’re
ready to go. Enter the trade as soon as the price touches the lower band and
the other confirmations are aligned.
11:19 - From there: Place your stop loss just above the
middle orange line to manage risk. Set your take profit at a
2:1 risk-to-reward ratio, giving you a solid return if the trade plays out. And that’s it! You’ve got yourself a simple yet
effective short trade that’s easy to execute.
11:35 - And now it’s time for the big
reveal—the SECRET TRICK that can help you avoid unnecessary losses and
make this strategy work even better. Here’s the deal: even when all the criteria
for a trade are met, there’s still a risk if the setup happens near a major support or
resistance level. Let me explain with an example. In one trade, everything lined up perfectly:
11:55 - The price touched the upper band.
The LWTI indicator was green. The volume bars were green
and above the white line. So, we entered the trade, set our stop
loss and take profit as usual—and yet, the trade ended up being a loss. Why?
When we zoomed out,
12:11 - it became clear that the trade was taken right
at a strong resistance level. Even though all the indicators gave valid signals, the price
reversed because of the strength of that level. The Fix: Use a Higher Timeframe to Spot Key Levels
Here’s the secret trick to avoid this issue: Switch to a higher timeframe,
like the 1-hour chart. On this timeframe, look for and mark all
the major support and resistance levels.
12:33 - Then, go back to your original timeframe and
avoid entering trades near these key levels. This extra step is simple but extremely
effective. It keeps you from trading into strong barriers where the price is likely to
reverse, helping you filter out bad setups. By adding this trick to your process,
you’ll avoid low-quality trades and focus only on setups with room to run. This
not only improves your win rate but also
12:53 - makes your strategy far more reliable.
Try it out—you’ll see the difference! So, in that trade we mentioned earlier, you’d
simply skip it because it was too close to a strong resistance level. After all, no trade
is always better than a bad trade, right? Now, here’s an extra tip to make
the strategy even more powerful. What we’ve found works exceptionally
well is when the price breaks through
13:14 - a resistance level and all the indicator
requirements are met at the same time. Think about it: The price breaking a resistance
level shows strong bullish momentum. When this breakout aligns with the upper band, a
green LWTI, and high volume, you’ve got a ton of confluence supporting the trade.
This type of setup often results
13:32 - in high-probability trades because the
momentum and breakout validate each other. If you combine this strategy with basic
support and resistance levels or even supply and demand zones, the results
are phenomenal. These levels give you additional context about market structure and
help you avoid entering low-probability trades. By waiting for confluence between the
strategy’s signals and these key levels,
13:54 - you’ll be stacking the odds
heavily in your favor. This tweak doesn’t just make the strategy
safer—it makes it far more effective! In conclusion, Larry Williams’ LW Volatility
Breakout Strategy is a powerful and proven method for capturing high-probability trades. By
combining Donchian Channels, momentum indicators, and volume confirmation, and enhancing
it with support and resistance analysis,
14:16 - you can filter out bad trades and
focus on setups with real potential. Patience and discipline are key. This strategy
keeps you focused on high-probability setups, trading only when the market aligns
with your rules. Trust the process, refine your execution, and let the strategy
work without emotional interference. If you found this helpful, check out our other
videos and visit our website for more insights.
14:38 - Thanks for watching, and see you in the next video
here at ComLucro! Best of luck in your trades!!! I hope you enjoyed today's video. If
you found the content useful or fun, please give it a like, as this helps
the video reach more traders like you. Remember to subscribe to the channel and
activate notifications to stay updated with the latest financial market information
and trading tips. Sharing this video with
15:01 - your friends or on your social networks
can make a big difference and helps our community become stronger. Your support allows
us to continue bringing high-quality content, helping you make more informed decisions in the
markets. Thank you for watching and good trading!
Perguntas Respondidas por esse Artigo
-
Qual é a estratégia de trading que Larry Williams utilizou para transformar $10.000 em $1.1 milhão em 12 meses?
-
Quais são os componentes chave da LW Volatility Breakout Strategy de Larry Williams?
-
Como posso usar Donchian Channels para melhorar meus resultados de trading?
-
Como os indicadores de momentum podem ajudar a identificar tendências no mercado?
-
Como a confirmação de volume pode ser utilizada para filtrar sinais falsos no trading?
-
Existe alguma dica para evitar perdas em mercados instáveis (choppy markets)?
