The Three Best Bollinger Bands Setups for Trading
📊 Mastering Bollinger Bands: 3 Proven Strategies for Traders
🔗 Explore more at: ComLucro Website
💡 In this video, we reveal the secrets of trading with Bollinger Bands! Learn how to identify breakouts, reversals, and pullbacks with precision. Whether you’re just starting or already a seasoned trader, these techniques will help you navigate market volatility like a pro.
👉 Key Takeaways:
Understand market volatility and its impact on trading.
Learn the mechanics of Bollinger Bands.
Master setups for breakouts, reversals, and pullbacks.
Discover how to adapt your strategies for low and high volatility.
🎥 Don’t miss out!
🔔 Subscribe to ComLucro YouTube Channel for weekly insights.
🌟 Like and share this video to help other traders improve their skills!
💬 Leave a comment below with your questions or thoughts!
💬 Connect with Us:
Website: https://www.comlucro.com.br/
Twitter: @CanalComLucro
#BollingerBands #TradingStrategies #MarketVolatility #DayTrading #SwingTrading #TechnicalAnalysis #TradingForBeginners #FinancialMarkets #Breakouts #Reversals #Pullbacks
00:00 - hello Traders welcome back to the Comm lukro Channel today we're diving into the world of Ballinger bands a powerful tool that helps Traders identify Market volatility and spot high probability
00:11 - setups whether you're just starting out or you're a seasoned Trader mastering Binger bands can give you a significant Edge in navigating various market conditions at Comm lucro our mission is
00:22 - simple to equip you with practical strategies and proven techniques that help you become a more confident and disciplined Trader no fluff no shortcut just actionable insights you can rely on
00:33 - if you're ready to elevate your trading skills you've come to the right place in this video we'll demystify the basics of Ballinger bands and reveal three powerful setups breakouts reversals and
00:44 - pullbacks that you can start applying right away don't forget to explore our other videos and visit our website for even more resources to sharpen your trading skills after this quick intro
00:54 - we'll jump straight into the world of Binger bands and unlock their full potential so stay tuned hey Traders if you're looking to level up your trading game give this video a thumbs up
01:05 - subscribe to the channel and hit that notification Bell so you never miss an update before we dive in we highly recommend checking out our playlists on trading psychology and risk management
01:17 - these videos can significantly help you manage emotions maintain discipline and develop effective risk management strategies key elements for achieving profitability in trading please listen
01:28 - and remember no amount of study stud to find the perfect trading strategy will benefit you if you lack emotional control during your trades if you cannot accept a losing trade and keep moving
01:38 - your stop loss or Worse trade without a stop loss you are setting yourself up for failure the efficiency of your strategy is directly tied to your risk management and emotional discipline only
01:50 - when a Trader understands and implements this can they start seeing consistent profits and end their months in the green without these critical elements even the best strategies will crumble
02:00 - under poor execution and emotional decision- making now let's get started let's begin with the basics of Binger bands this popular trading indicator is based on volatility so
02:14 - before diving into its mechanics it's essential to First understand what volatility really means simply put volatility refers to the speed at which prices move it's important to note that
02:24 - price movements are not consistent they vary between periods of low and high volatility in a low volatility environment prices move slowly taking a considerable amount of time to cover
02:34 - even small distances this creates small irregular price swings often resulting in red or green candles with little to no momentum these periods are commonly referred to as sideways or range-bound
02:45 - markets now why does this matter during such low volatility phases trading can be particularly challenging because price movements are minimal however on the bright side these movements tend to
02:56 - be somewhat organized and predictable this means Traders can still find opportunities for small calculated trades if they proceed with caution on the other hand we encounter High
03:06 - volatility environments during these periods prices move swiftly and decisively creating large price swings and prominent candles these movements are driven by strong momentum which
03:16 - often characterizes what Traders call trending markets now here's the key while high volatility environments can present exciting trading opportunities they also require a different approach
03:26 - entries and exits must be more aggressive as prices can quickly shift in any direction in contrast low volatility environments demand a more cautious conservative trading style this
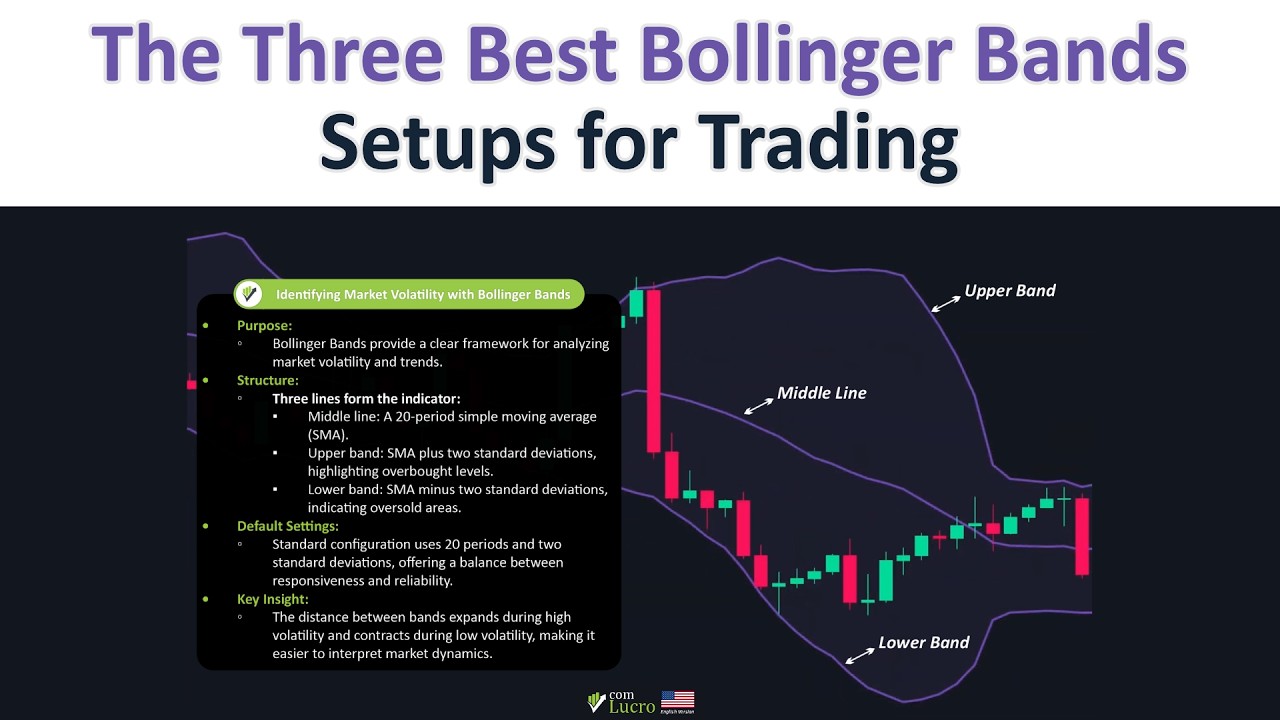
03:37 - brings us to an important question how can you effectively identify Market volatility the answer lies in the Ballinger bands indicator Ballinger bands are specifically designed to make
03:46 - assessing Market volatility straightforward the indicator consists of three lines with its default settings established at 20 periods and two standard deviations the middle line
03:56 - represents a 20 period simple moving average the upper band is calculated by adding two standard deviations to this average while the lower band is determined by subtracting two standard
04:06 - deviations from it before we go any further let's take a moment to address an important detail about Ballinger bands their default calculation by default Ballinger bands are configured
04:16 - based on the closing prices of candles which is a commonly used and effective approach for most Traders however there's another popular method where the bands are calculated using different
04:26 - price points such as the highs lows or even the average of the highs and lows this difference can have a significant impact on how the bands behave it's important to note that since the default
04:37 - setting relies on closing prices there may be times when the bands appear narrow even if the highest or lowest points of the candles show significant price movement this occurs because the
04:47 - bands are primarily influenced by the closing price which may not fully reflect the extent of price fluctuations within the selected time frame understanding this Nuance is essential
04:57 - for interpreting Binger bands effectively if you want to explore these configuration options in more detail I recommend pausing the video and checking out our in-depth explanation of
05:06 - Ballinger band setups this will help you customize the indicator to better suit your trading style now that we've covered the nuances of Ballinger bands calculations and how they can impact
05:15 - their behavior let's shift our Focus back to how these bands respond to market conditions during periods of low volatility Ballinger bands narrow significantly reflecting the lack of
05:25 - strong price movement in these conditions prices often move sideways within the Bands bouncing between the upper and lower limits most of the time the price remains contained within these
05:35 - boundaries interestingly when the price closes above the upper band it typically reverses downward similarly if the price closes below the lower band it tends to reverse upward in contrast High
05:46 - volatility periods cause the bands to widen signaling increased Market activity during an uptrend the price gravitates towards the upper band and may even close a few candles above it
05:56 - without immediately reversing likewise in a downtrend the price stays near the lower band with occasional candles closing below it without triggering a reversal this Behavior makes Ballinger
06:06 - bands an excellent tool for assessing volatility and adapting your trading strategy accordingly if you prefer Trend trading it's best to avoid placing trades when the bands are narrow as
06:16 - these conditions indicate low volatility instead focus on trading when the bands are wide signaling stronger Market momentum conversely if your strategy is centered on reversals narrow bands
06:28 - provide better opportunities while wide bands should be avoided that said it's important to note that you cannot trade blindly based solely on the size of the Ballinger bands a successful trade
06:38 - requires a well-defined strategy supported by a solid set of rules if you're finding this video helpful so far take a moment to hit the like button and subscribe to our Channel by doing so
06:48 - you'll never miss any of our future trading tips and strategies now let's dive back into the content let's explore some basic setups using Ballinger bands setup one breakouts a breakout occur URS
06:60 - when the price moves decisively out of a sideways market and transitions into a trend timing is critical here entering at the right moment allows you to capture a significant price movement
07:10 - while keeping your stop-loss tight Ballinger bands can help identify these breakout opportunities with Precision to start we first need to identify a sideways market look for areas on the
07:20 - chart where the Binger bands are relatively narrow indicating low volatility during this time the price should also exhibit a sideways movement bouncing within the bands ensure that
07:29 - the price has stayed within the bands for most of this range with the upper boundary acting as resistance and the lower boundary providing support once these conditions are met it's time to
07:39 - watch for the breakout for example let's say a solid green candle breaks and closes above the upper band as mentioned earlier prices generally stay within the Ballinger bands so this breakout
07:50 - indicates strong momentum in the market such a move confirms a valid breakout setup and a potential trading opportunity let's now look at a bearish breakout in this scenario we identify a
08:00 - tight sideways range where the Ballinger bands are squeezed together indicating extremely low volatility the candles during this phase move sideways and remain confined within the narrow range
08:12 - the upper band acts as resistance while the lower band provides support confirming the tight consolidation Zone we patiently wait for the price to break out of this range either above or below
08:22 - the bands in this example a large red candle breaks and closes below the lower band the strong close indicates significant down Ward momentum validating this as a bearish breakout
08:32 - setup setup two reversal setup bowling your bands can also be highly effective for identifying potential reversals as mentioned earlier the price tends to stay within the bands most of the time
08:44 - when the price touches or breaks the upper or lower band it often signals an imminent reversal let's start with a sell setup imagine the price is trading in a sideways range contained within the
08:55 - upper and lower bands on one particular candle the price touches the upper band and immediately reverses downward it then moves to the lower band confirming the reversal later the price touches the
09:06 - upper band again and once more reverses downward this repeated Behavior highlights the reliability of Ballinger bands in spotting reversal setups now for a bullish reversal setup the process
09:17 - is similar but reversed here the price touches the lower band on a specific candle and immediately reverses upward the price then continues its upward movement eventually reaching the upper
09:27 - band this confirms that Bullinger band can also effectively identify bullish reversal opportunities setup three pullbacks pullbacks using Ballinger bands are one of the simplest and most
09:38 - effective ways to trade within a trending Market to begin it's crucial to identify the Market's Trend when the price is moving between the upper and middle bands it indicates an uptrend in
09:48 - such cases we focus on buying opportunities during pullbacks these pullbacks often bring the price down to the middle band which acts as Dynamic support this is where we look to enter a
09:58 - Buy trade conversely when the price is moving between the middle and lower bands it signals a downtrend in this scenario we look for selling opportunities during pullbacks the
10:08 - middle band acting as Dynamic resistance is the ideal point to enter a cell trade by using the Binger bands you can align your trades with the trend while taking advantage of these predictable pullback
10:19 - opportunities in conclusion Binger bands provide a versatile tool for navigating various market conditions offering three key setups breakouts reversals and pullbacks each setup caters to different
10:31 - trading scenarios helping Traders identify opportunities with greater Precision however to maximize their effectiveness Ballinger bands should always be used in combination with other
10:41 - tools by incorporating confluences like support and resistance levels Candlestick patterns and trend lines you can significantly enhance the accuracy and reliability of your trades remember
10:52 - a well-rounded strategy is the foundation of consistent success in trading I hope you enjoyed today's video If you you found the content useful or fun please give it a like as this helps
11:03 - the video reach more Traders like you remember to subscribe to the channel and activate notifications to stay updated with the latest Financial Market information and trading tips sharing
11:14 - this video with your friends or on your social networks can make a big difference and helps our community become stronger your support allows us to continue bringing highquality content
11:24 - helping you make more informed decisions in the market thank you for watching and good luck on achieving giving excellent results in your trades
Perguntas Respondidas por esse Artigo
-
Quais são as principais estratégias de negociação com Bandas de Bollinger ensinadas no vídeo?
-
O que são as Bandas de Bollinger e como elas podem ajudar na negociação?
-
Como as estratégias de Bandas de Bollinger podem ser adaptadas para diferentes níveis de volatilidade?
-
Onde posso encontrar mais informações e conteúdo sobre estratégias de negociação?
