Top Candlestick Patterns Every Day Trader Must Know!
📊 Top Candlestick Patterns Every Trader Should Master!
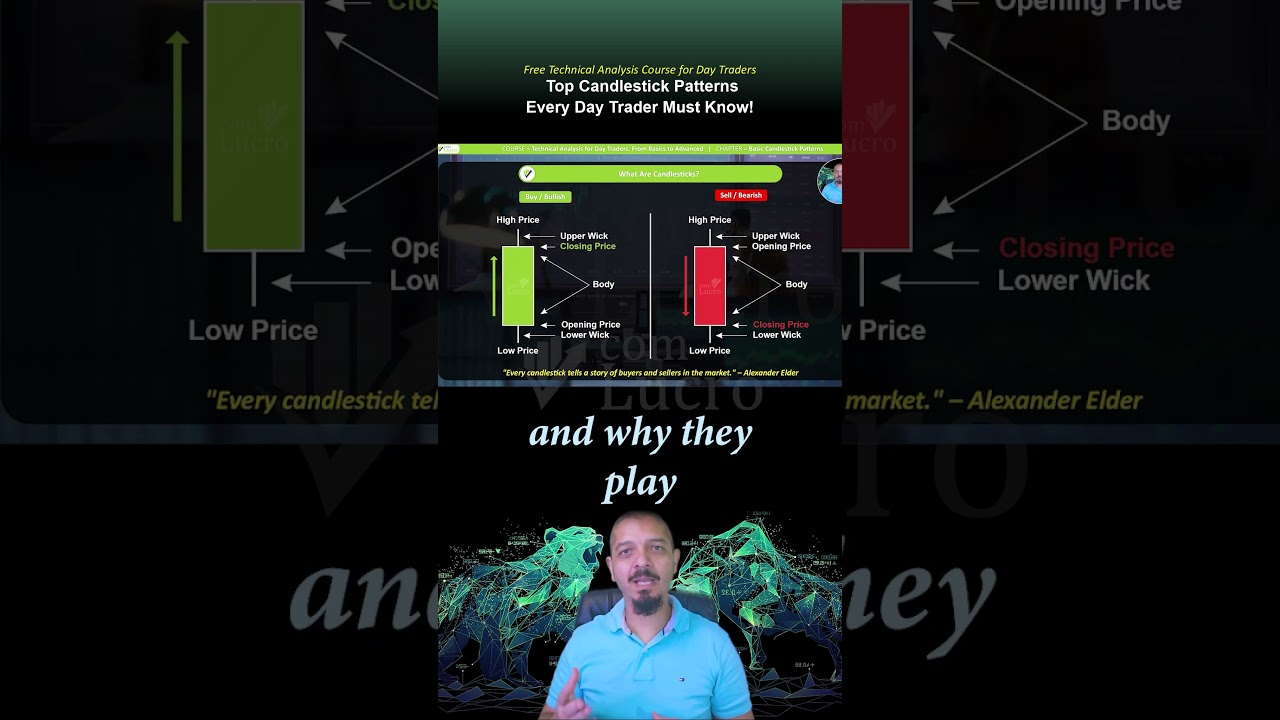
Understanding candlestick patterns is essential if you want to read the market with precision. In this clip from our full course Technical Analysis for Day Traders, we’ll break down key concepts like body size, wicks, pin bars, and doji types — helping you spot reversals and continuations with confidence.
🚨 A single candle can mislead — context and multiple time frames are key!
🎥 Watch the full video here: https://comlucro.com.br/youtube
🌐 Learn more: https://www.comlucro.com.br/
📈 Tools we recommend: https://www.tradingview.com/?aff_id=119375
#CandlestickPatterns #TradingEducation #ComLucro #PriceAction #DayTrading #PinBar #Doji #TechnicalAnalysis #Forex #SupportAndResistance
00:00:00,240 --> 00:00:04,800
Hello traders, and welcome back to the local
channel. In today's chapter of our course,
00:00:04,800 --> 00:00:08,640
Technical Analysis for Day Traders From
Basics to Advanced, we'll be covering a
00:00:08,640 --> 00:00:14,080
fundamental aspect of trading basic candlestick
patterns. Learning how to read and interpret
00:00:14,080 --> 00:00:18,480
candlestick patterns is crucial for gaining
an edge in the financial markets, as these
00:00:18,480 --> 00:00:24,000
patterns often signal key turning points driven
by market sentiment and institutional activity.
00:00:24,000 --> 00:00:28,560
In this video, part of our Candlestick Patterns
chapter, we'll walk you through the essentials
00:00:28,560 --> 00:00:33,120
of candlesticks, how they are formed and why
they play such an important role in technical
00:00:33,120 --> 00:00:38,160
analysis. We'll break down important concepts
like body size wicks and how to interpret these
00:00:38,160 --> 00:00:43,200
elements to better understand the price action.
We'll also cover common single candle patterns
00:00:43,200 --> 00:00:48,480
such as bullish and bearish pin bars, different
types of doji, the hammer and the marbles pattern,
00:00:48,480 --> 00:00:52,800
helping you spot potential reversals
and continuations in market trends.
00:00:52,800 --> 00:00:58,080
That said, relying solely on a single candle
can sometimes be misleading. It's crucial to
00:00:58,080 --> 00:01:01,760
take multiple timeframes into account to
gain a more complete picture of market
00:01:01,760 --> 00:01:05,920
behavior and make well-informed trading
decisions. So if you're ready to deepen
00:01:05,920 --> 00:01:09,440
your knowledge and elevate your trading, don't
miss the full video on our channel. Watch now.
