Uncovering the Accumulation Diagram: How to Anticipate the Next Trend
📈 Mastering the Wyckoff Accumulation Diagram: Complete Guide for Traders 📈
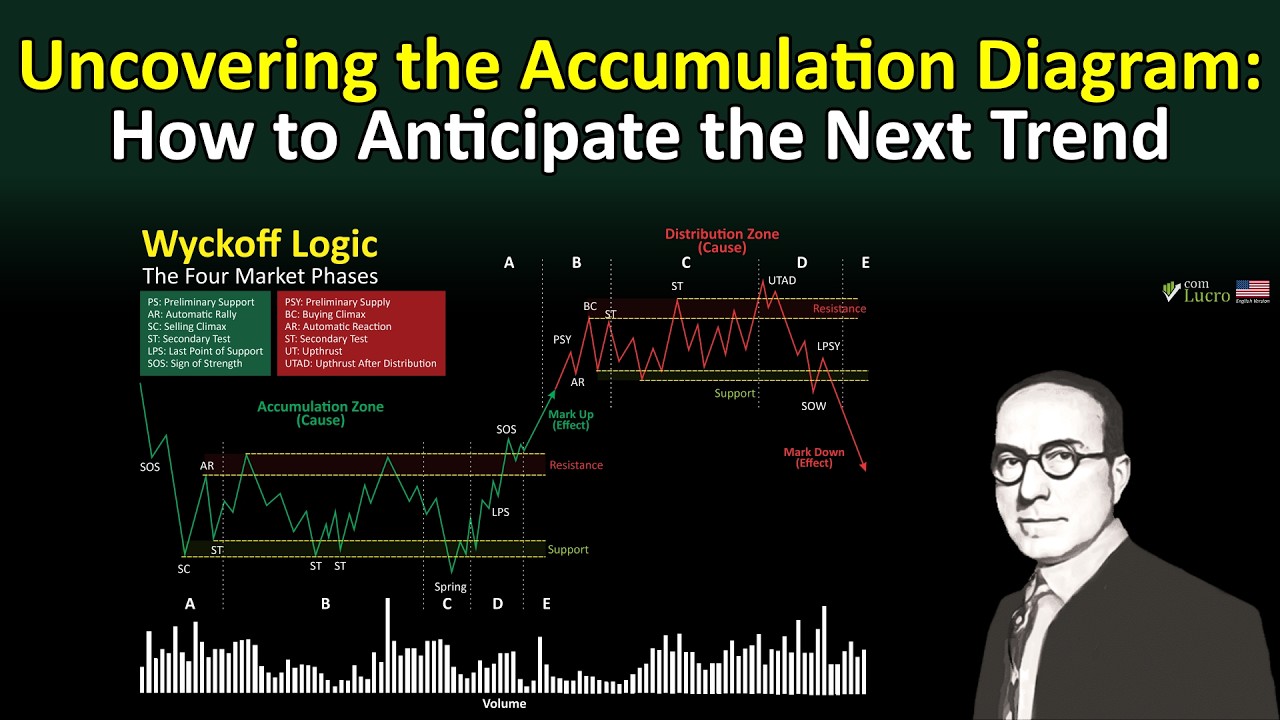
Hello, traders! Welcome back to the ComLucro channel! In today’s video, we’re diving into the Wyckoff Accumulation Diagram—an essential tool for understanding market psychology and spotting strategic buying and selling opportunities.
Recommended Tools: TradingView – https://www.tradingview.com/?aff_id=119375
In this episode, we’ll break down what the Accumulation Diagram is, how it reveals the hidden strategies of major market players, and the specific phases that indicate when and where accumulation is occurring. This knowledge will help you interpret the market with greater precision, understand the intentions behind price movements, and improve your trading strategies.
We’ll guide you through each phase of the Accumulation Diagram, from Preliminary Support to the Markup phase. By the end, you’ll be able to identify these phases in real market conditions, pinpointing ideal entry and exit points aligned with institutional behavior. And remember, this video is just one valuable resource in our Wyckoff Method Course! Don’t forget to check out our other videos and visit our website for more in-depth information.
💡 Key Points:
0:00:00 – Welcome and introduction
0:00:08 – Accumulation Diagram and market psychology
0:01:06 – Course resources and additional recommendations
0:01:15 – Suggested playlists on trading psychology and risk management
0:01:36 – Importance of emotional control and risk management
0:02:10 – Core of the chapter: Accumulation Diagram analysis
0:02:29 – What is the Accumulation Diagram?
0:03:01 – How to recognize phases and avoid mistakes
0:03:14 – Foundational aspects of the Accumulation Diagram
0:03:42 – Wyckoff Diagrams and market dynamics
0:04:46 – Focus on the Accumulation Diagram’s structure
0:05:29 – Recognizing accumulation patterns in volume and price
0:05:45 – Phase A: Beginning of Accumulation
0:06:54 – Phase B: Consolidation
0:07:56 – Phase C: Preparation for Markup
0:09:02 – Phase D: Transition to Markup
0:10:04 – Phase E: Markup
0:11:05 – Common errors in interpreting the Accumulation Diagram
0:12:20 – Multi-timeframe analysis for better phase identification
0:13:14 – Combining Wyckoff with other analysis tools
0:14:03 – Conclusion and final thoughts
🔔 Subscribe to the Channel: Don’t miss our upcoming videos!
👍 Like & Share: Support our channel and help us reach more traders like you!
💬 Comment Below: Share your thoughts or ask questions; we’d love to hear from you!
💬 Connect with Us:
Website: https://www.comlucro.com.br/
Twitter: https://twitter.com/canalcomlucro
🔔 Subscribe and hit the bell to stay up-to-date with the latest trading strategies!
Hashtags:
#AccumulationDiagram #WyckoffMethod #Trading #FinancialMarket #MarketPsychology #InvestmentStrategies #TechnicalAnalysis #CompositeMan #DecisionMaking #TradingVolume #EntryPoints
5000
